Notwithstanding the short-term benefits, if pursued intensely, these EM ‘QE’ programmes could cause serious problems in the medium to long run, such as inflation overshooting and debt distress. Systematic bond purchases over a long period of time by a central bank can open the door to debt monetization and jeopardise monetary policy credibility. If QE implies large amounts of liquidity injections by the central bank in local currency, it can become inflationary and also destabilize the exchange rate. In this case, the QE could bring about bigger problems by putting debt sustainability and the private sector’s balance sheets at risk.
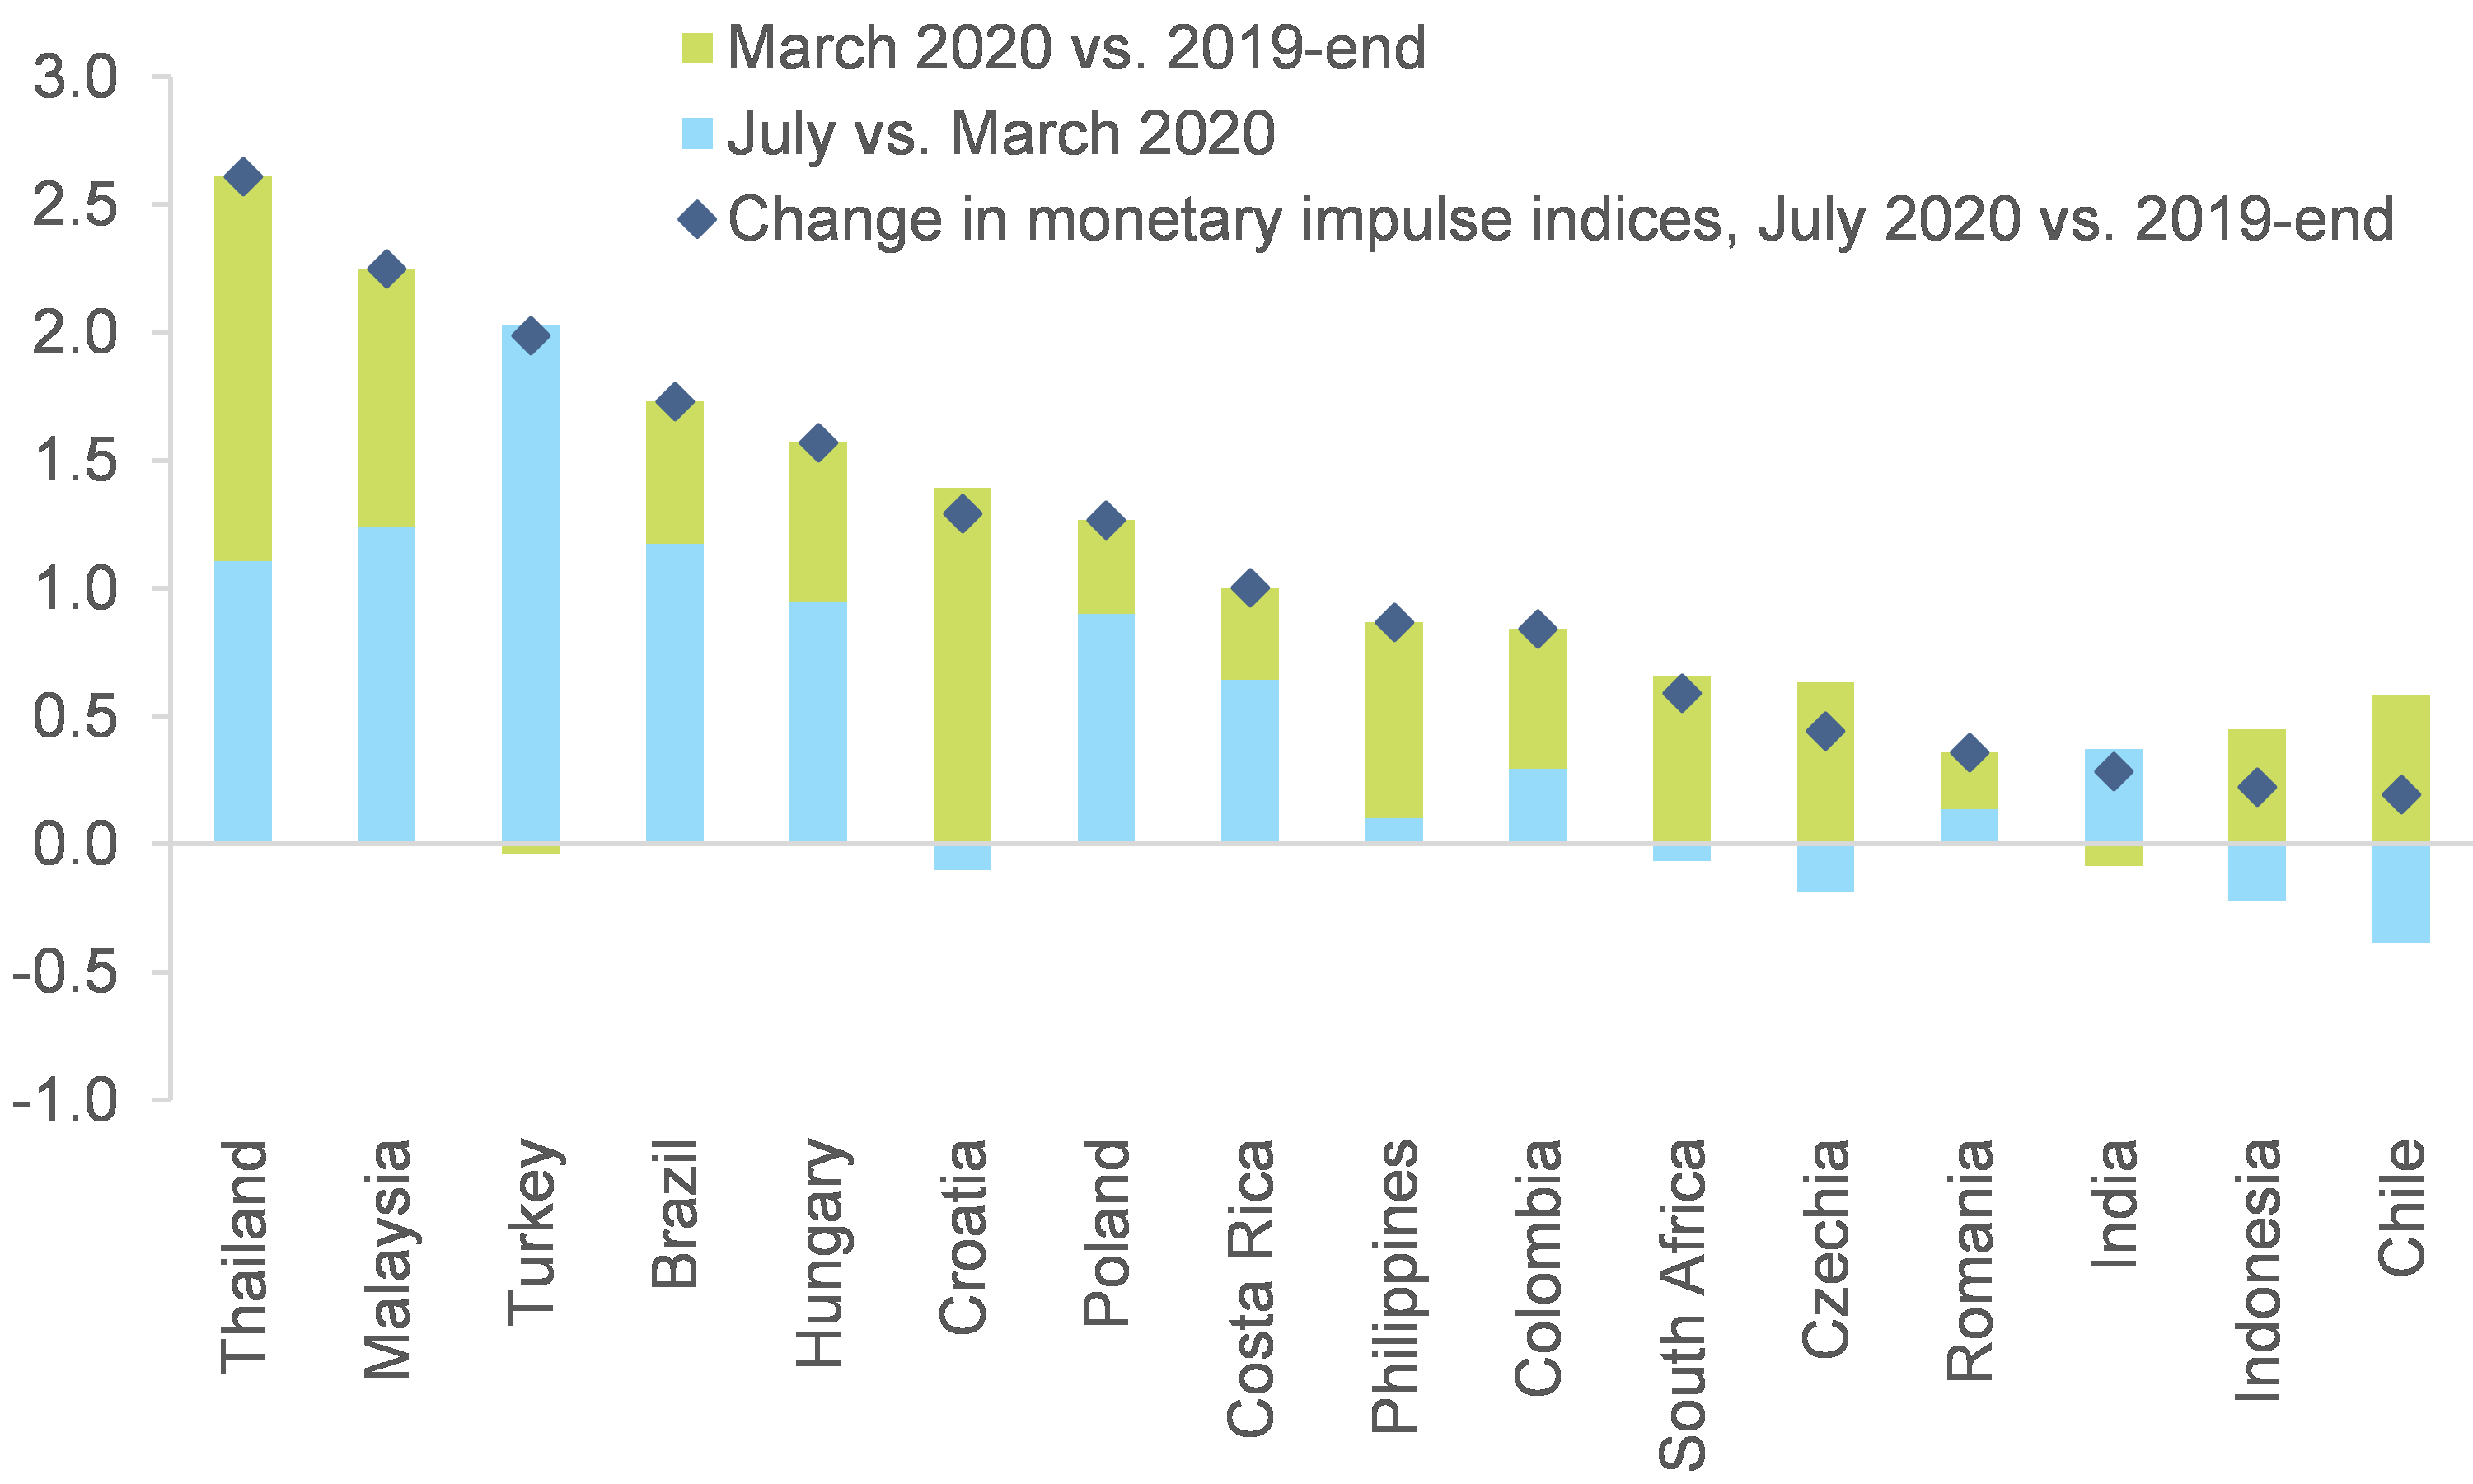
The lack of a clear framework on the size and length of ongoing and planned EM ‘QE’ programs could be a concern. While the central banks of the 16 EMs analyzed in this study all stated reasonable objectives (mainly to provide liquidity and ensure a smooth functioning of domestic government bonds markets) for their bond-purchase programs, most of them neither announced a maximum amount that they intend to buy nor a definitive time-frame for their programs. Hence, there is a risk that the QE programs would not be tapered once the objectives have been lastingly reached. For these countries, there could also be a temptation to ease their mounting local-currency debt burdens by simply inflating them. In this context, the QE programs of Indonesia and Poland have generated some concern that the central banks may actually be monetizing state debt beyond appropriate limits. The banks purchased government bonds to the tune of 6.8% and 4.6% of GDP from March to August, respectively, the highest ratios among the 16 EMs. Indonesia’s central bank is to date the only one that has also conducted purchases directly on the primary market, a step normally considered ‘taboo’, though markets have been lenient so far. And regarding Poland, there are worries that if purchases are continued at the current pace until end-2020, the central bank would be financing roughly the entire fiscal deficit of this year, projected at around -8% of GDP.
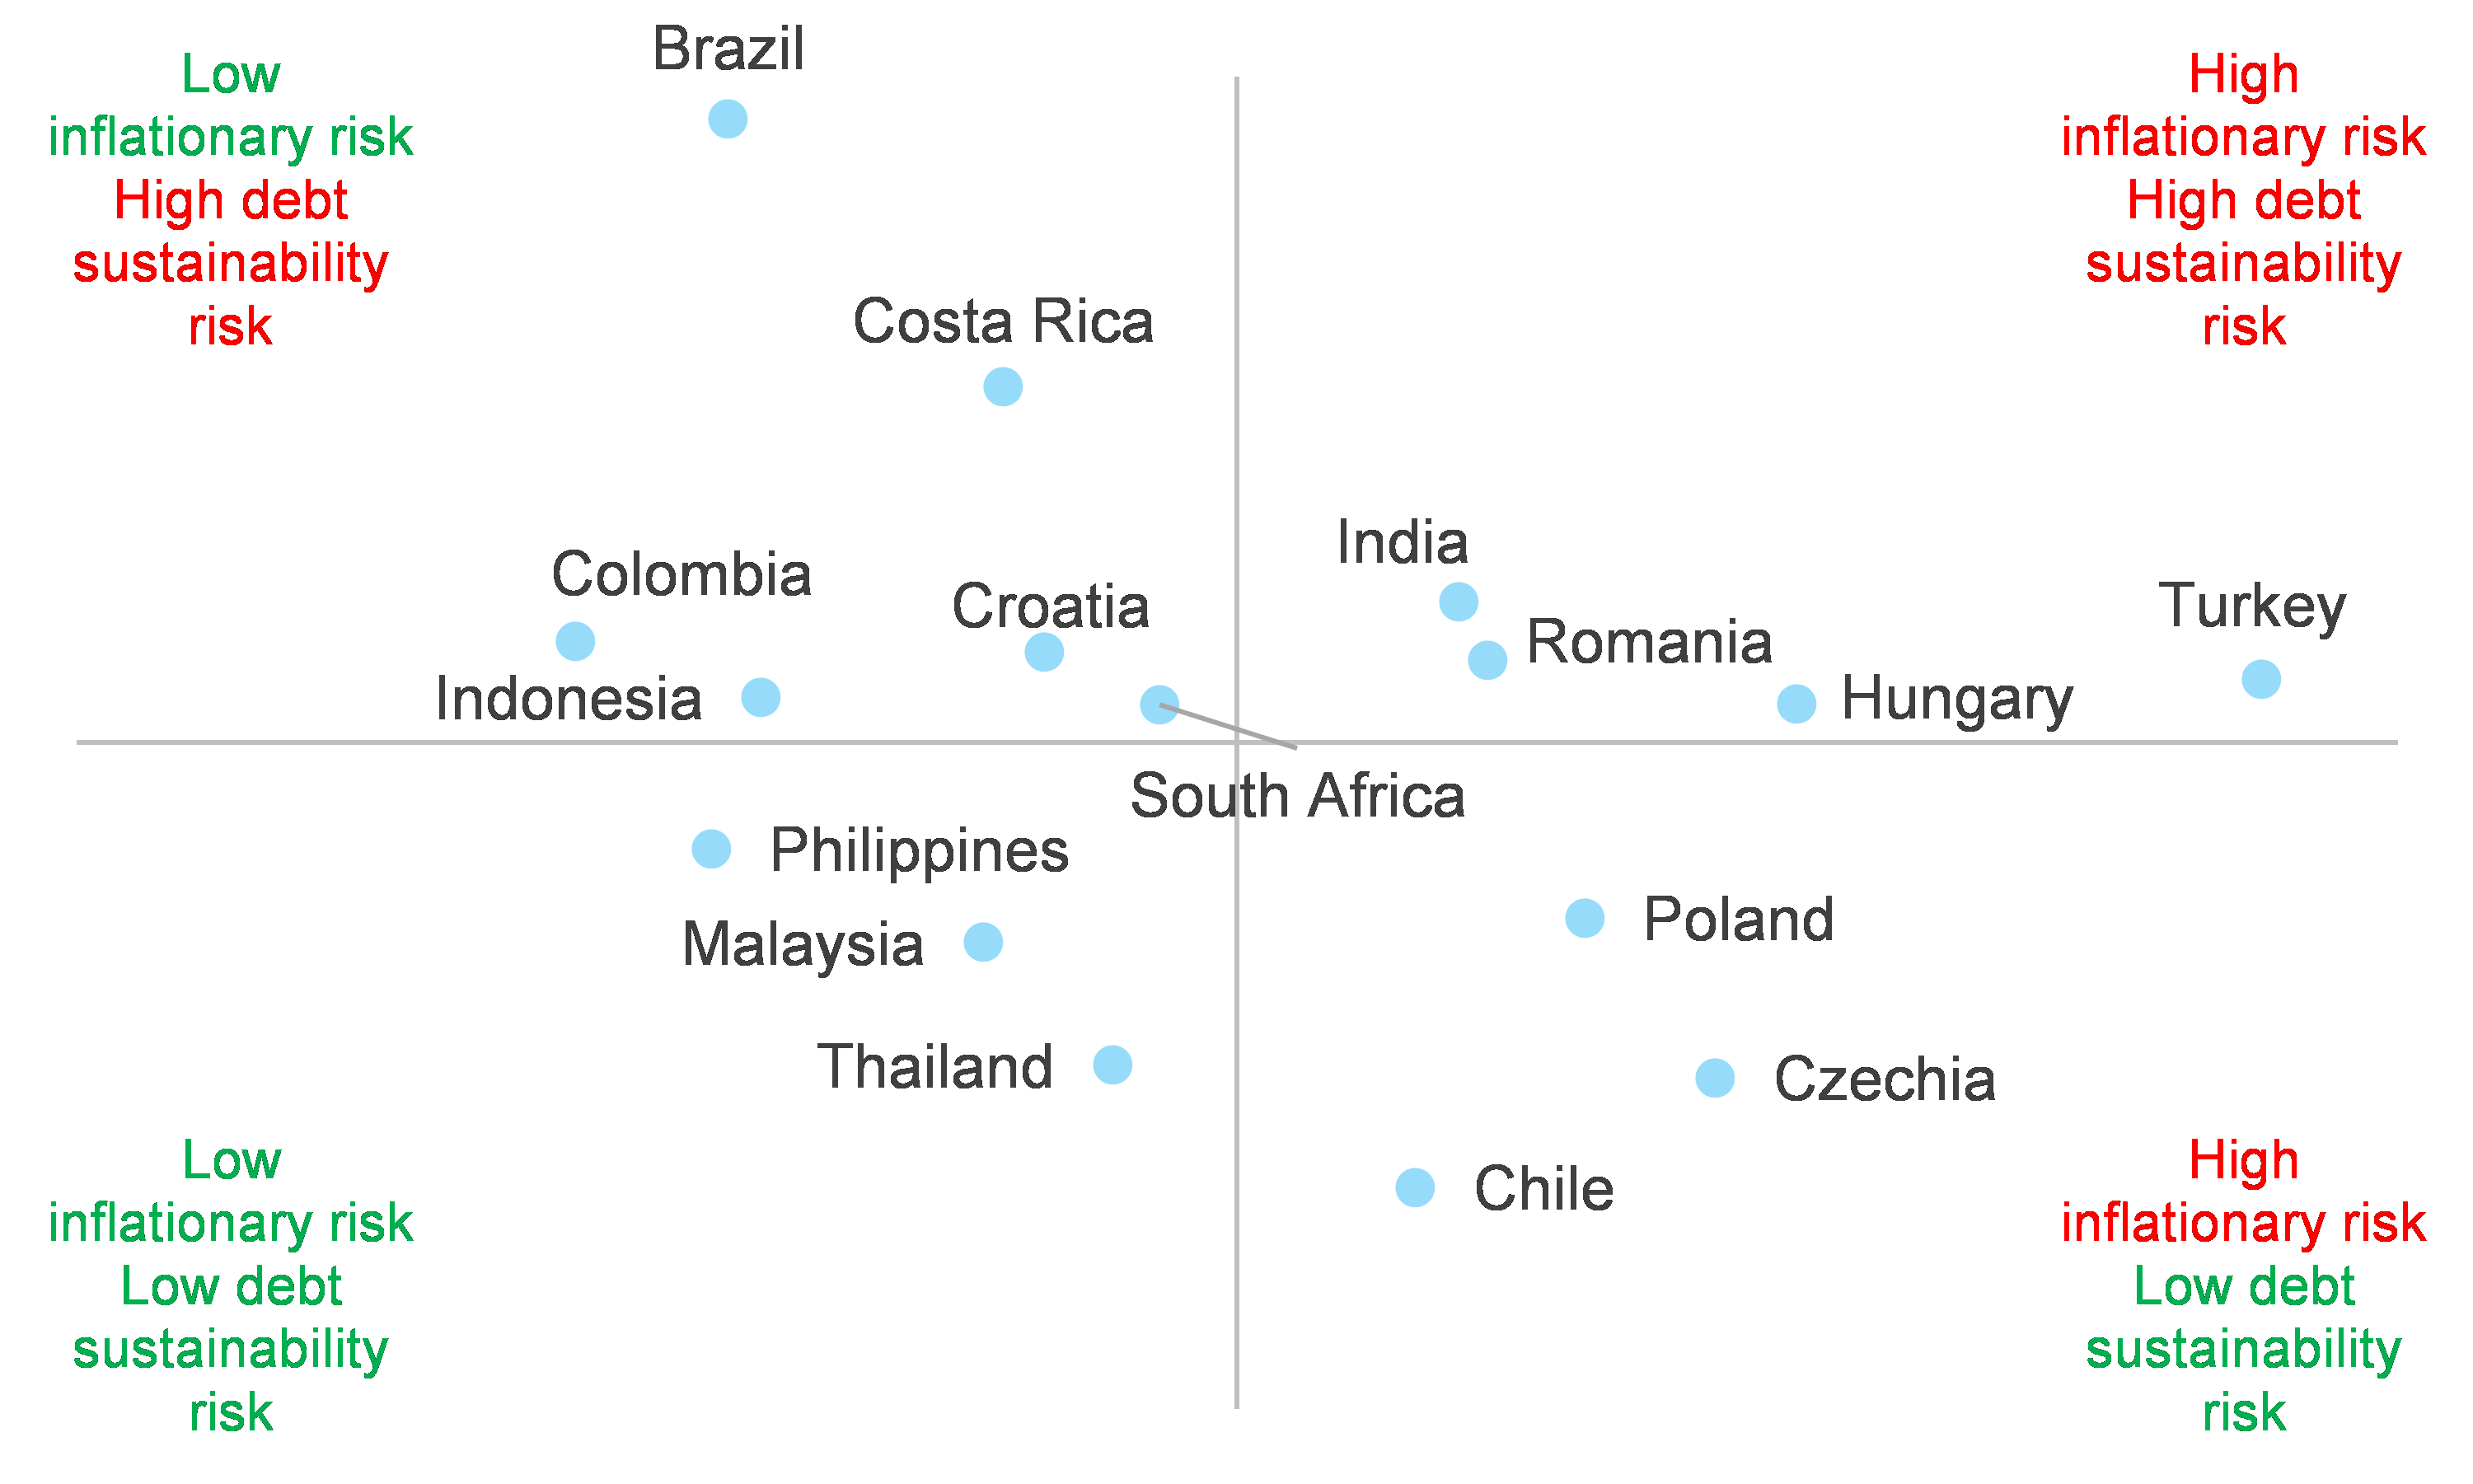
Which EMs pursuing QE face the highest debt sustainability risk? We find that Brazil, Costa Rica, India, Colombia and Croatia carry the highest debt distress risk. Brazil gets the worst ranking in our Debt Sustainability Risk Score owing to its very high public debt and central bank holdings of government debt. At the same time, the low level of government effectiveness suggests the unlikeliness of passing on fiscal reforms to improve the situation (see Figure 5 in the Appendix for details on the score). Costa Rica is ranked second highest risk due to a large interest payment burden and the highest rise in its bond spread YTD (+357bps). However, the bond purchases of Costa Rica, as well as of Colombia and India, have been of modest size so far. Only Croatia’s central bank has already bought government bonds worth 4.2% of GDP since March and thus needs more scrutiny in the near term. Meanwhile, Poland, which has bought more than Croatia, scores well in our analysis, thanks to low interest payments (3.7% of fiscal revenues) and a relatively effective government. Indonesia is not among the top five riskiest markets, thanks to a comparatively low total public debt burden (37% of GDP). South Africa, usually a suspect for debt risks, is ranked average as its high overall public debt (78% of GDP) is balanced by the fast-growing but still low share of FX public debt (11% of the total).
Which EMs pursuing QE face the highest inflationary risk? Turkey, Hungary, Czechia, Poland and Romania show the highest risk of inflation overshooting. Our Inflationary Risk Score signals that Turkey clearly faces the highest inflationary risk as it is the only country with a double-digit inflation rate (11.8% y/y in July) while the current policy rate appears too low (8.25%). Moreover, M2 growth has a high correlation of 79% with future inflation and it rose by +44% y/y in July, the highest pace by far among the 16 EMs we look at (see Figure 5 in the Appendix for details on the score). The four Central European countries that join Turkey in the top five riskiest markets regarding inflationary pressures also have significantly negative real (inflation-adjusted) policy rates while annual inflation has increased in recent months and is now close to the respective central banks’ inflation targets. India, which follows close in rank 6, posted an elevated inflation rate of 6.9% y/y in July and also has a negative real policy rate, but a moderate dependence on the imports of essential goods and a weak link between M2 and price growth.
Debt sustainability and inflation are intertwined as debt monetization increases the public debt burden and raises the risk of inflation. Looking at the combined risks, our analyis identifies Turkey, Hungary, Romania and India as the most risky EMs that have implemented QE-style programs in the wake of the Covid-19 pandemic and crisis (see Figure 2). To close the Pandora’s Box before things get out of control, these QE-like policies should be conducted in a temporary manner and under a well defined framework.
Figure 2 – Debt Sustainability and Inflationary Risk Scores