Executive summary
- The global recovery is on the right track albeit conditional on key differentiating elements across countries. Global GDP is expected to rebound by +5.1% in 2021, with one fourth of the recovery being driven by the US, while China should contribute less to growth by progressively adopting a less accommodative economic policy. In 2022, world GDP growth should reach +4.0%. Europe should recover its Covid-19 losses only at this horizon against H2 2021 for the US. The race to recovery will hinge on seven key obstacles.
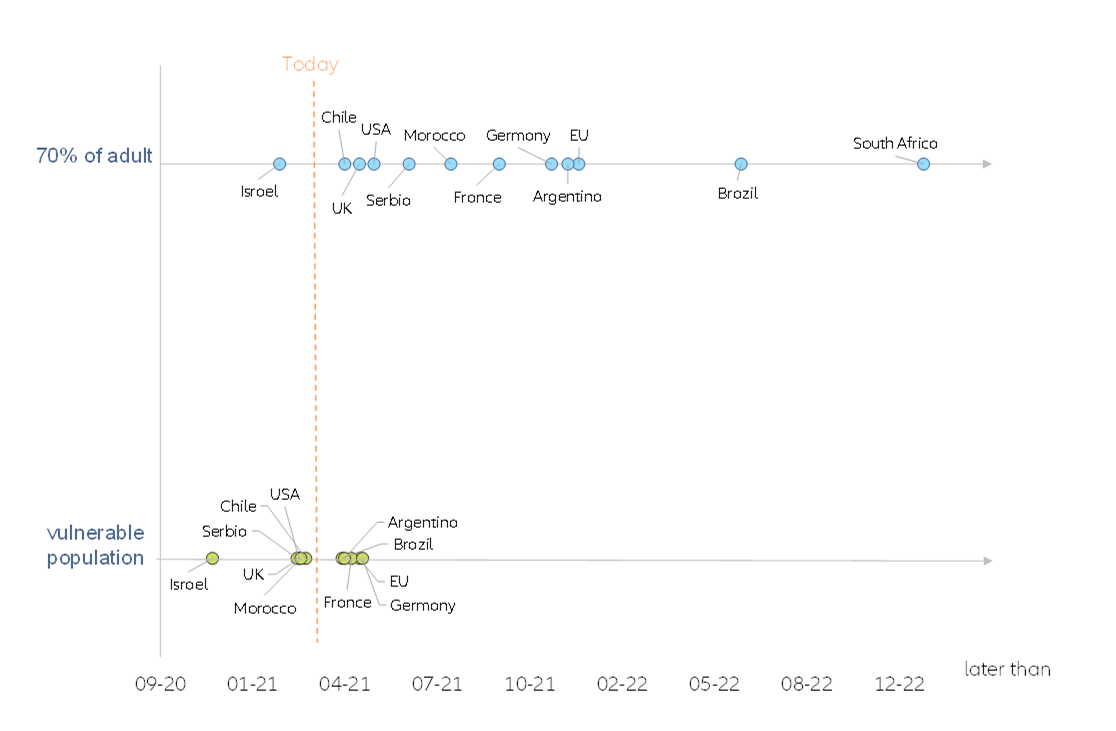
- Obstacle 1: Formula 1 race on vaccination. Execution risks will remain a key differentiator between countries, with the pace of vaccination campaigns driving a multi-speed recovery and keeping divergence at high levels. At the current pace of vaccination, the US and the UK will reach herd immunity in May. While Europe should be able to vaccinate its vulnerable population by the summer, herd immunity is not likely to be reached before the fall at the current pace. On the other hand, most governments (France) are speeding up the vaccination pace to reach herd immunity during the summer.
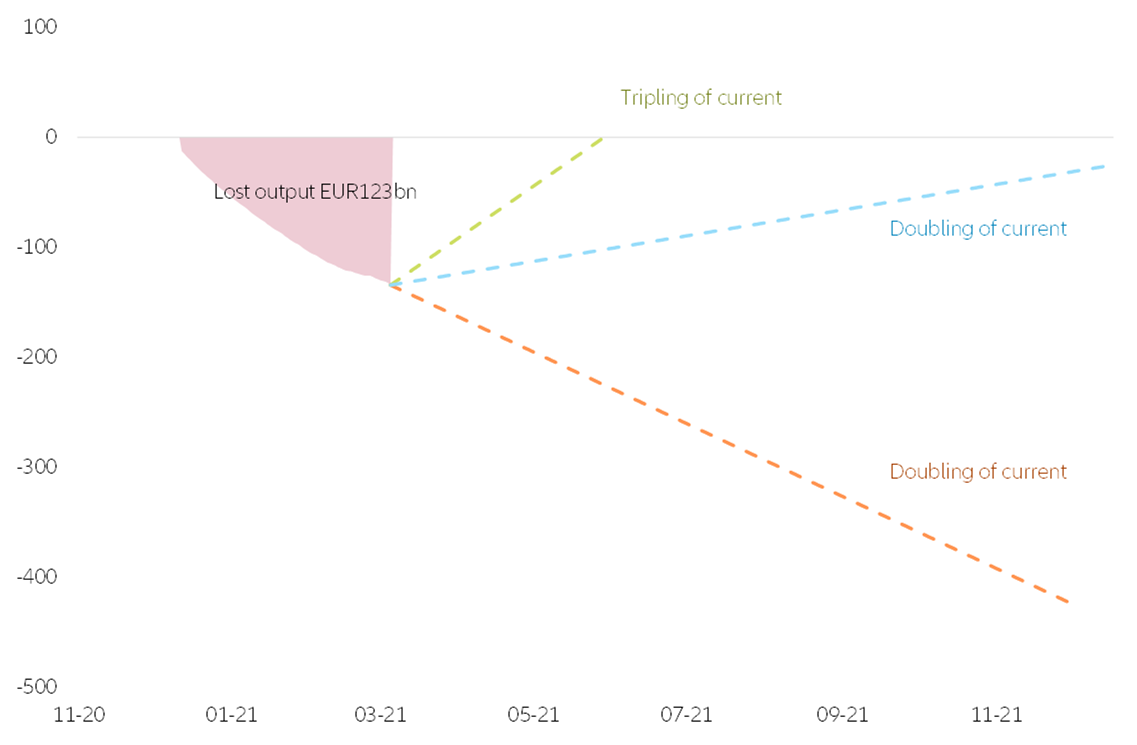
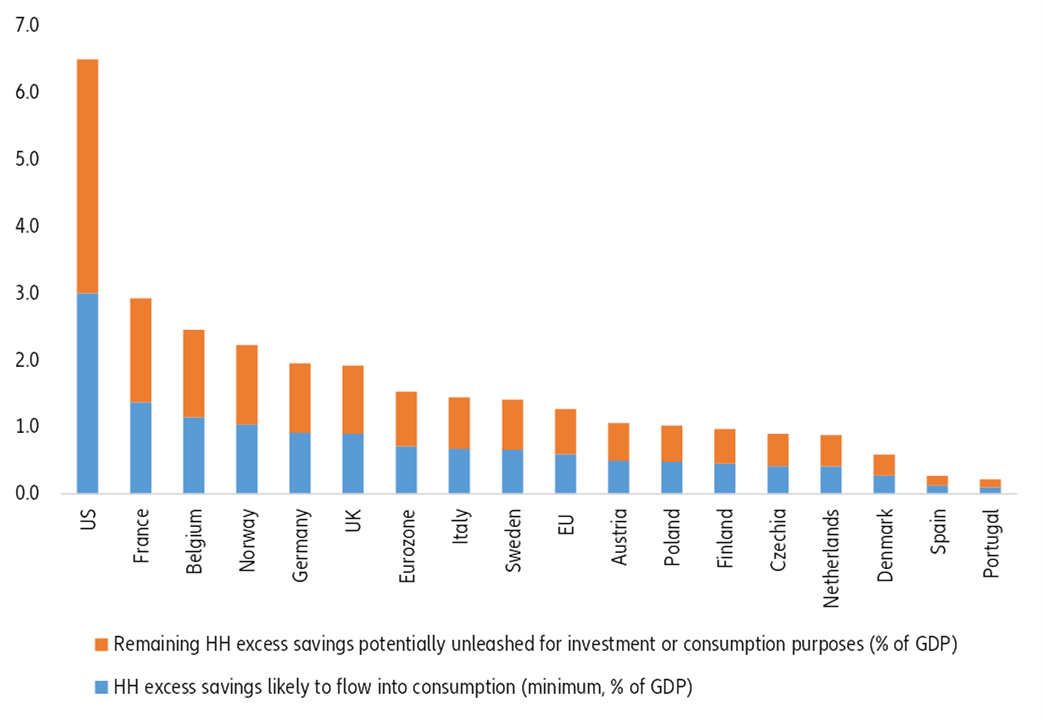
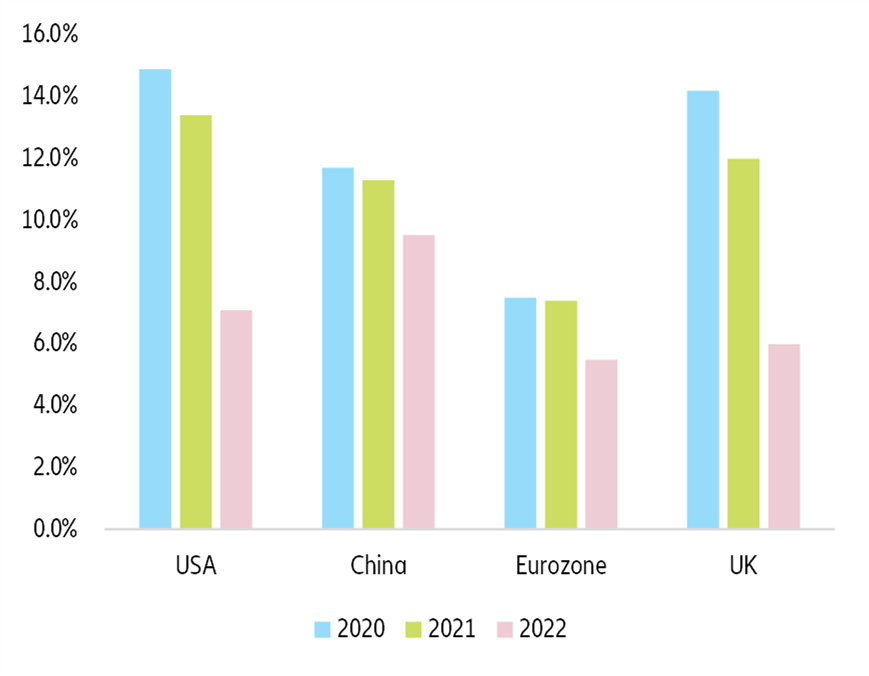
- Obstacle 2: Excess savings will still hover around 40% above pre-crisis levels at end-2021. In a relatively optimistic scenario, excess savings from households should provide a tailwind to consumer spending to the tune of +1.5% of GDP in Europe and more than +3% in the US in 2021. Close to the same amount could be added on top for investment or consumption abroad purposes should confidence effects play a positive role. We calculate that around EUR163bn could be transformed into private consumption in the Eurozone, equivalent to 30% of the Covid-19 excess savings. However, in the US, we expect 50% of the current excess savings to be spent in 2021 as an earlier loosening of restrictions and more powerful fiscal impulses should boost the confidence effect. The US household savings rate should be back to a normal level at close to 7% of gross disposable income at end-2021.
- Obstacle 3: Phasing out assistance mechanisms is not a zero-sum game and the risk of policy mistakes remains high. After the “whatever it takes” consensus in 2020, fiscal policy will march to the beat of national drums going forward. In 2021, the consensus to do “whatever it takes” is already giving way to more heterogeneous policy prospects. In China, the path towards a fiscal normalization has already started, with fiscal targets implying a clear withdrawal of policy support in 2021, even if some flexibility will be kept to managecredit risk if needed. The global demand torch will pass to the US, with its gigantic USD1.9trn fiscal stimulus (9% of GDP). Europe's fiscal response pales in comparison: the Next Generation (NGEU) fund will only extend a helping hand from H2 2021 onwards and the growth impact (a cumulative +1.5pp until 2025) should prove moderate and delayed, given its focus on the supply side – 2/3 of the EUR313bn grants are likely to be used for investment – and drawn-out payments.
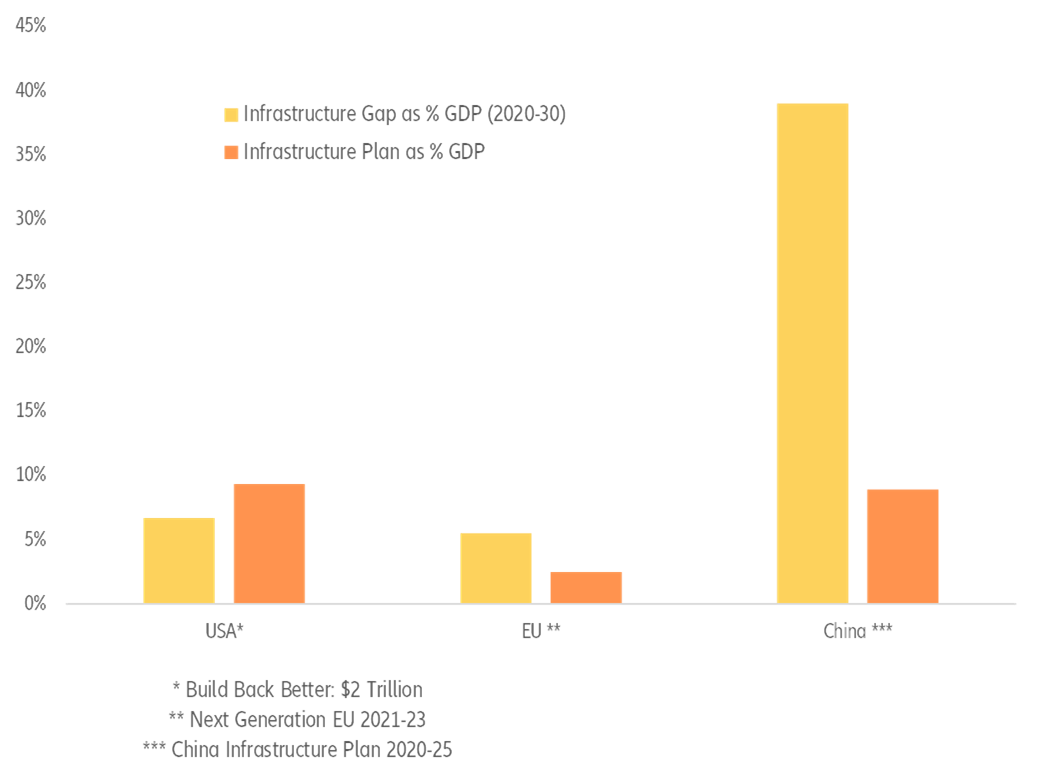
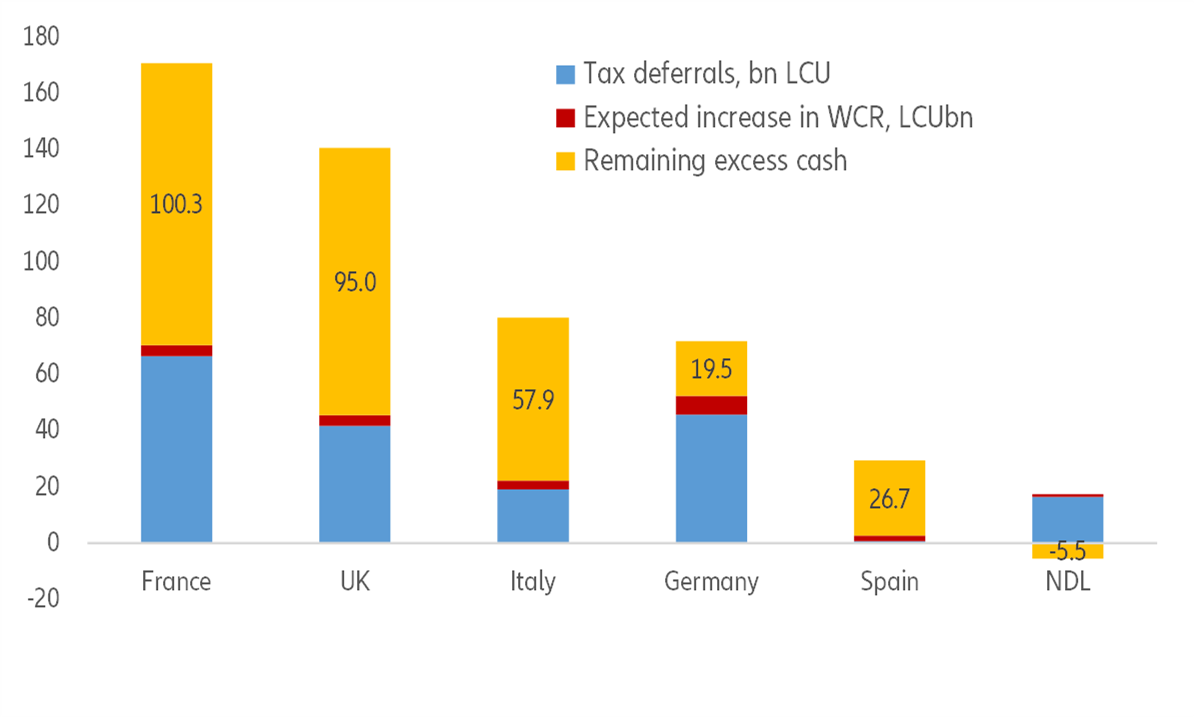
- Obstacle 4: Crowding-in vs. crowding-out effects on investment are not yet resolved. Joe Biden’s “Build Back Better” in the US (potentially USD2.3trn), the EU Next Generation of EUR725bn fund and China’s infrastructure plan totaling more than YUD1.5trn by 2025 will all contribute to support demand and the global economy’s growth potential over the medium-term. But their success depends on whether governments can channel excess savings to productive projects and boost private sector. We find that EUR100bn of excess savings could increase business investment by around +2% y/y in Germany, France and the UK, but much of this will depend on future tax policies and the funding conditions (e.g. recovery state-guaranteed loans).
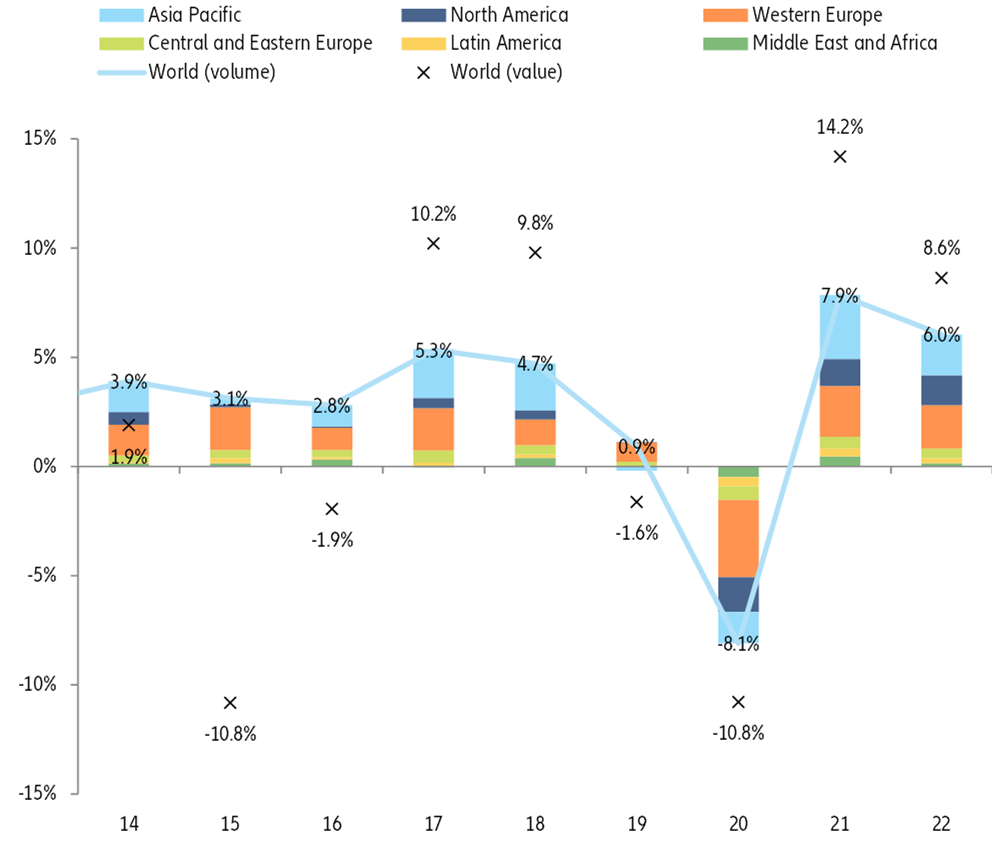
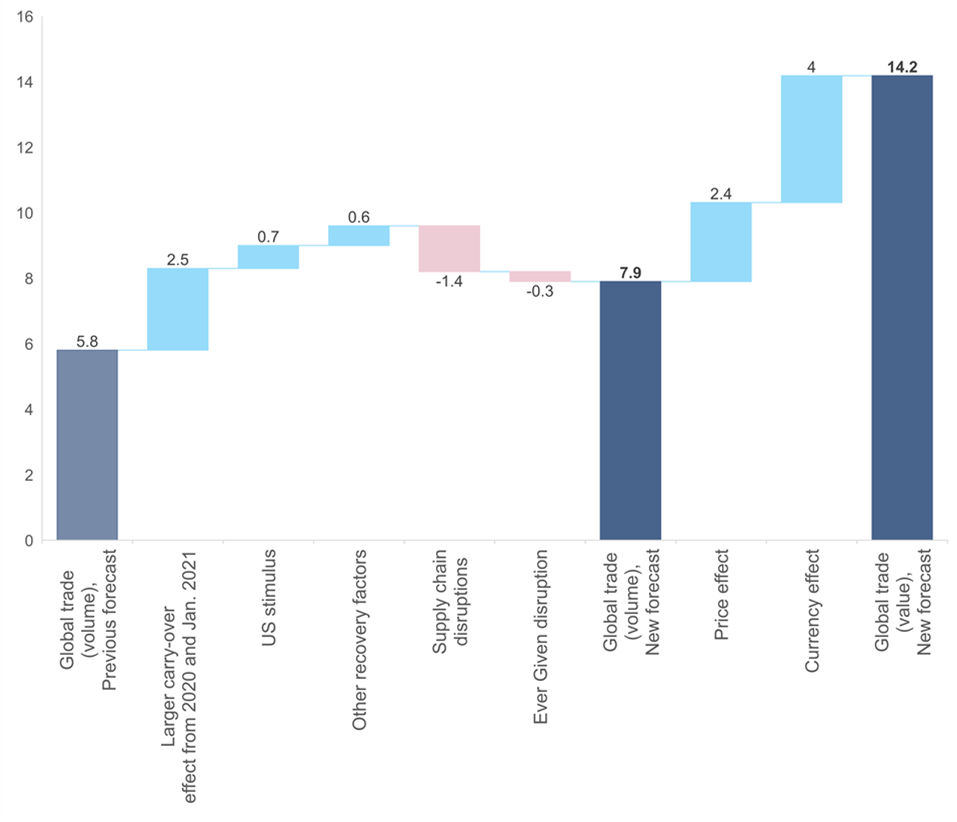
- Obstacle 5: Bottlenecks in the global supply chain are as high as during the peak of the pandemic and should push global trade into a borderline recession in Q2. Global trade growth will rebound to +7.9% in 2021 in volume terms, but excluding the positive base effects from 2020 growth will stand at +5.4%. More importantly, we expect a temporary slowdown in Q2 2021 due to prevailing supply-chain disruption: for the full year 2021, we estimate that the impact of supply-chain disruptions could weigh on global trade growth by -1.7pp. In addition, trade in services will remain impaired by the delayed reopening of sectors most impacted by Covid-19-restrictions and continued barriers to cross-border travel.
- Obstacle 6: Temporary overshoot of inflation. A temporary overshoot of inflation is likely to be driven by temporary base effects. Hence, companies’ pricing power is likely to remain limited, given subdued demand dynamics: (i) excess savings from households and NFCs that act as a drag on money velocity; (ii) persistently negative output gaps due to lower capacity utilization and (iii) rising unemployment rates that will keep a lid on wage growth (below 3%). Therefore, we don’t expect central banks to stage a policy U-turn as a reaction to inflation temporarily overshooting in the US at 3.5% by mid-2021 and hitting the 2% target for a few months in the Eurozone.
- Obstacle 7: Not putting an end to the sweet music of market’s reflation. Risky assets are operating under the assumption that what is good for them – unconventional monetary policy and fiscal profligacy – is necessarily good for the real economy, which will ultimately validate their optimism. For the time being, however, what we see is a widening divergence between asset prices and their underlying value. Amplified by various investment management techniques (ETFs, risk-parity) that put asset allocation on automatic pilot, this divergence is a vulnerability. An inadvertent escalation in geopolitical tensions between the US and China, surging inflation that wrong-foots the subdued inflation expectations held by central banks or nationalistic impulses prevailing over the common good in Europe are all exogenous triggers that could put its widening in reverse. But exogenous sources of risk are always easier to identify than endogenous ones: the danger is more likely to come from within capital markets. As shown by the rise of options trading and margin debt, leveraged investing is pervasive, and so is the confusion about liquidity: especially in capital markets, the velocity of money (the flow of liquidity) is far more volatile than its quantity (the stock of liquidity). In the presence of leverage and overtrading, risk-taking is prone to running amok and even a minor shock to confidence can lead to a sudden drying up of liquidity, forced liquidations and/or default.