EXECUTIVE SUMMARY

  • Inflation is back with a vengeance in the Eurozone, sending the cost of living to record highs. Aside from pandemic-related base and one-off effects, snarled-up global supply chains have failed to keep up with post-pandemic demand. To add to this, the war in Ukraine and sweeping lockdowns due to China’s zero-Covid policy have further disrupted trade flows and contributed to exploding commodity prices – notably for energy. Europe has been particularly affected, given its stronger reliance on energy imports and the recent depreciation of the euro to a five-year low against the US dollar.
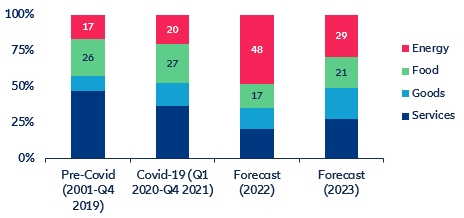
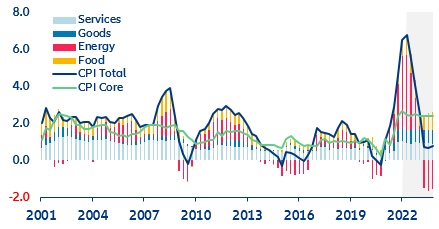
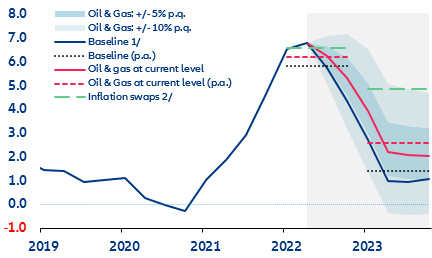
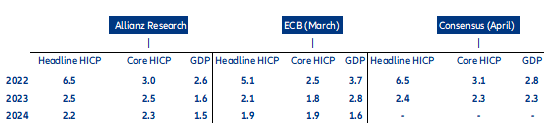
  • Is the worst yet to come? Without an EU embargo on oil and gas imports from Russia, headline inflation is very likely to peak in the second quarter of 2022. Inflation dynamics will hinge on energy and food price developments, which explain around two-thirds of the current surge. As negative base effects phase in over time, still-elevated core inflation will become the driver of consumer price pressures next year. We expect Eurozone inflation to register at 6.5% y/y this year and 2.5% y/y next year. Core inflation will remain unusually high during our forecast period, settling at 3.0% y/y and 2.5% y/y on average – more than twice the rate observed during the decade running up to the Covid-19 shock.
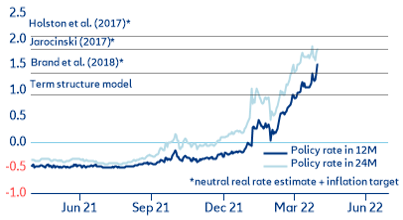
  • Rising stagflation risks put the ECB in a dilemma—a first rate hike in September seems probable. Higher inflation and lower growth impose hard policy trade-offs in a world where classic aggregate demand support has little impact in the face of strong cost-push pressures causing negative supply shocks. The disappointing Q1 GDP performance across the Eurozone underlines the economic costs of the war in Ukraine as well as the heightened risk of a stagflation scenario. We expect economic growth to evolve below consensus over the near term, which should also put a dampener on wage pressures and support a more dovish stance. However, clearer signs of second-round effects in wage growth and inflation expectations could require an earlier tightening.

How high could inflation go in the Eurozone?

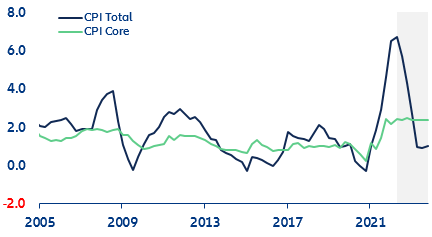
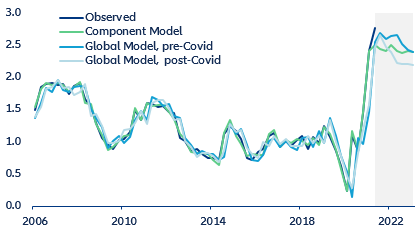
The Eurozone is facing the highest price pressures since the 1970s. Headline inflation reached 7.5% y/y in April (up from 7.4% y/y in March), with almost 60% explained by energy inflation. Europe has been hit particularly hard, given its stronger reliance on energy imports and the recent depreciation of the euro to a five-year low against the US dollar.

What is driving current inflation pressures? Aside from pandemic-related base and one-off effects, the surge is largely due to the combination of a strong re-opening momentum and snarled-up supply chains as the fragile global production and distribution system failed to keep up with post-pandemic demand, especially for goods. Russia’s war with Ukraine has further exacerbated inflation dynamics, driven above all by a sharp increase in commodity prices – notably for energy. More recently, China’s zero-Covid policy and the related lockdowns of important industrial centers have put additional strain on supply chains, which threatens to keep shipping costs and producer prices higher for longer. As the war in Ukraine drags on and eradicating the Covid-19 virus becomes an ever more elusive goal, the implications of the rising cost of living are far-reaching and raise hard questions about the adequacy of commonly used inflation models and in turn policy choices derived from these.

Figure 1: Evolution of headline and core inflation (y/y, %)

 Figure 1: Evolution of headline and core inflation (y/y, %)
Sources: Refinitiv, Allianz Research
Inflation keeps surprising on the upside, and pipeline price pressures are still building, suggesting that the peak remains ahead. However, past inflation dynamics suggest that the second-round effects of the initial price shocks (especially food and energy) will gradually abate over the course of the year. While the Eurozone has been exposed to cost shocks before, the magnitude and the underlying causes for the current price shocks are unusual, which could lead to a case of inflation remaining higher for longer. Structural changes due to an inefficient reallocation of resources during the post-pandemic recovery could also lead to different inflation dynamics. For instance, global supply chains may have been permanently damaged, or the labor market may turn out much tighter than the unemployment rate would suggest.

We use two model-based approaches to forecast the development of Eurozone inflation over the next two years. We specify a “component model” to measure the strong impact of energy prices on headline inflation by unpacking the inflation dynamics in separate sub-components. Our component model relies on four separate models, one for each sub-component, with headline inflation defined as the weighted sum of four subcomponent indices for energy, food, services and goods. Core inflation consists of the less volatile services and goods components. By aggregating the results, we compute headline and core inflation forecasts. To measure the structural effects of current price pressures on core inflation, we follow the canonical approach of an augmented forward-looking Phillips curve model (“global model”) based on a single equation (see Technical Annex). Both models are estimated with a simple ordinary-least square (OLS) regressions with efficient lag structures and all variables in first differences.

Our model results suggest that rising energy prices will continue to drive inflation dynamics this year, causing headline inflation to remain substantially higher than core inflation. The situation should reverse only in H1 2023 once negative base effects kick-in more forcefully (Figure 1).  In the past, the energy component used to be largely explained by the oil price and the EUR-USD exchange rate. However, following Russia’s invasion of Ukraine and the resulting energy price shock, the role of the gas component in explaining energy inflation has risen to around 30%. Historically, core inflation accounted for 55% of consumer price increases in the period between 2001 and 2021. In 2022, we estimate that only 35% of headline inflation will be attributable to core inflation, with the remainder explained by food (17%) and energy (48%) (Figure 2).

Figure 2: Contribution to headline inflation by component (%)
Sources: Refinitiv, Allianz Research. Note: “Pre-Covid” and “Covid-19” cover the time periods Q1 2001-Q4 2019 and Q1 2020-Q4 2021, respectively.
Figure 3: Evolution of headline and core inflation by component (y/y %, quarterly average)
Sources: Refinitiv, Allianz Research. Note: */ includes the energy component with oil prices only (no natural gas); the variable selection for the services and goods component models does not vary depending on the estimation horizon (Q1 2020 and Q4 2021).
Headline inflation will start declining only later in the year. Given the key role of energy prices in current inflation dynamics, we simulate different energy price scenarios and their impact on headline inflation. We expect headline inflation to peak in Q2 2022 based on our baseline oil and gas forecasts, which excludes an EU embargo on Russian oil and gas imports (Figure 4); this result would still hold even if energy prices remain constant at current elevated levels until the end of next year. However, oil and gas prices are likely to decline in the absence of further political escalation, and if they do, we expect disinflationary forces (also due to base effects) to weigh on headline inflation next year. In our adverse scenario (“black-out”) of an EU embargo on Russian energy exports further raising energy prices, the peak of headline inflation would be delayed until the end of the year; this would cause significant carryover effects into 2023, when headline inflation could reach close to 5% on average. We find that energy prices would need to increase by 5% each quarter on average this year for inflation to remain above 3% next year. Current inflation swaps spreads seem to have already priced in an adverse scenario, suggesting an increase of energy prices by almost 10% each quarter on average, consistent with our model estimates (Figure 4).

Figure 4: Headline inflation paths under different energy price scenarios (y/y %, quarterly average)
Sources: Refinitiv, Allianz Research. Note: 1/ based on Allianz Research oil & gas forecasts (quarterly smoothed; Figure 5 below); 2/ Inflation swaps at one-year and two-year maturities.
Over the medium term, we expect core inflation to be back in the driving seat. We complement our components approach with an augmented Phillips curve model (“global model”) to capture the fundamental inflation trend. Among others, this model links core inflation to the output gap (i.e., the degree of underutilized resources in the economy), US headline inflation (to account for the global nature of current cost-push shocks) and the EURUSD exchange rate (to reflect the rise of imported inflation due to the weakening euro, see Annex, Table A4). We assume that there is still sufficient slack in the economy (the output gap is expected to close only after next year), with Eurozone GDP still below its pre-pandemic level. Like in the components approach, we estimate the model at first differences. To ensure comparability as well as to mitigate potentially distorting estimation results from the pandemic, we differentiate between two main sample periods: one prior to the pandemic and one incorporating effects from the pandemic. We further differentiate, at least in the post-Covid-19 sample, between market- as well as survey-based inflation expectations. The model suggests that Eurozone core inflation should remain in a range between 2.2% and 2.4% until end-2023. It therefore confirms the results of the component model.

Figure 5: Eurozone comparison of core inflation forecast using the component and global models (%)
Sources: Refinitiv, Allianz Research
Table 1: Macroeconomic projections (%)
Sources: ECB, Refinitiv, Allianz Research

In this context, stagflation risks put ECB in a dilemma

How should the ECB react? The next few months will be critical, especially when the ECB presents its latest macroeconomic projections at the June and September policy meetings. Higher inflation and lower growth impose hard policy trade-offs in a world where classic aggregate demand support has little impact amid strong cost-push pressures causing negative supply shocks. The disappointing Q1 GDP performance across the Eurozone underlines the economic costs of the war in Ukraine as well as the heightened risk of a stagflation scenario.

Overall, we expect Eurozone inflation to register at 6.5% in 2022 and 2.5% in 2023, with core inflation settling at 3.0% and 2.5%, respectively. Notably, the jump in food inflation in the recent April inflation release could be troublesome, given its strong impact on households' inflation expectations. We expect economic growth to evolve below consensus this year and especially next year, which should also put a dampener on wage pressures and support a more dovish stance (with a first rate hike only expected in September). In particular, a sharper slowdown in growth or the potential for fragmentation due to sovereign stresses could lead to a slower policy normalization. However, clearer signs of second-round effects in wage growth and inflation expectations could require an earlier tightening.  

Mounting concerns about the surge in inflation have led to a cautious pivot towards a more hawkish monetary stance, which might be short-lived. Some ECB officials have already flagged the possibility of an end to QE as soon as July, together with a first rate hike. Markets have fully embraced the hawkish narrative, pricing the terminal policy rate in contractionary territory above most neutral rate estimates (Figure 7). In contrast to the US, where markets already expect a reversal of monetary policy and are pricing in rate cuts as early as H2 2023, short-term rates in the Eurozone still exhibit a normal (albeit front-loaded) cycle. Given the weakening activity and the high traction of US monetary policy on global short-term rates, we believe that inflation expectations will converge at some point, resulting in a shorter hiking cycle in the Eurozone.

Figure 6: ECB policy rate expectations reach contractionary territory

Figure 6: ECB policy rate expectations reach contractionary territory
Sources: Refinitiv, Allianz Research