EXECUTIVE SUMMARY

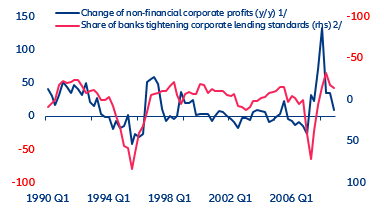
  • The flattening (and partially inverted) US yield curve is signaling rising recession fears. There are signs that a rapid hiking cycle could narrow the window for a “soft landing” as a slowing economy amid elevated energy prices makes a recession increasingly probable. Corporate earnings have already halved from the recent peaks while the credit impulse has turned negative as banks have begun tightening their lending standards.
  • However, the US economy has not reached an overheating phase (and growth is in fact slowing), with the policy rate still at record low levels. Corporate and household balance sheets have become less vulnerable to rising interest rates, thanks to rising cash buffers and lower leverage. But we believe the US Federal Reserve could raise the policy rate by not much more than 200bps without causing a recession, for instance, triggered by a collapse of the US housing market.
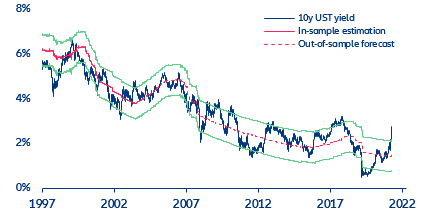
  • Under baseline conditions, long-term rates have little room to rise further; however, in light of recent shift of the yield curve dynamics to longer maturities, the 10-year US Treasury yield could soon test the 3%-mark before declining during the remainder of the year.

The Fflattening (and partially inverted) US yield curve is signalling rising recession fears.  But will they come true?

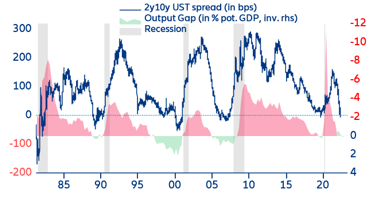
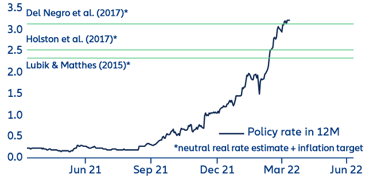
In response to the US Federal Reserve’s increasingly hawkish stance, short-term rates have risen by over 200bps since last September. And following the first rate hike in March, markets are now expecting a further increase of the Federal Funds rate by 150bps during the next three FOMC meetings at a probability of almost 70%. With US headline inflation reaching 8.5% y/y in March (and rising at its fasted pace since 2005 at 1.2% m/m) following a surge in energy and food prices, these expectations are unlikely to change soon despite core inflation (i.e. after excluding energy and food prices) moderating to a monthly increase of only 0.3%. In this context, the US yield curve has increasingly flattened over the past few weeks, and in some parts even inverted, signalling rising concerns about an impending recession. The most iconic slope, the 2y10y Treasury spread, is extremely flat, flirting with inversion (Figure 1). 

Figure 1: Slope of the US yield curve as recession indicator

Figure 1: Slope of the US yield curve as recession indicator
Sources: Refinitiv, Allianz Research

Several fundamental developments suggest that the Fed’s rapid rate hikes could increase downside risks to the economic outlook. Despite higher resilience compared to the period prior to the subprime mortgage crisis, the highly interest rate-sensitive real estate sector (18% of GDP) is already reacting negatively to surging mortgage rates (30-year fixed rate mortgages at close to 5%). In addition, the manufacturing sector is showing signs of declining output, which is not only due to stressed supply chains (new orders). While corporate balance sheets may still look healthy, earnings have already halved from the recent peaks as inflation shrinks margins in competitive sectors with limited pricing power.

Figure 2: Corporate profits and bank lending standards

 Figure 2: Corporate profits and bank lending standard
Sources: Refinitiv, Allianz Research
Note: 1/ Non-financial corporate profits after tax (y/y, based on seasonally adjusted quarterly data); 2/ Net percentage of banks tightening corporate lending standards for large and middle-market firms (not seasonally adjusted quarterly values)
The current combination of a slowing economy, a flat yield curve and elevated energy prices has almost always been a harbinger of recession. The credit impulse has turned negative, with banks tightening their lending standards (Figure 2). Tighter financing conditions will put pressure on small businesses, which account for almost 50% of US employment. We already see a reversal of increasing NFIB job openings, which usually leads rising unemployment by six months. Historical evidence suggests that an about 1pp-rise in the unemployment rate (from 3.6% currently), which slightly more than what would be required to align current wage increases (4.6% y/y in March) with the Fed’s inflation target, is likely to result in a recession (Figure 3).

Figure 3: US-Labor market dynamics
 Figure 3: USLabor market dynamics
Sources: Refinitiv, Allianz Research
Note: 1/ Average weekly earnings of all employees (y/y, based on seasonally adjusted quarterly data); 2/ Total nonfarm (millions), seasonally adjusted.

All this is certainly not going to help household confidence already dented by real income losses. And if interest rates continue to rise, demand support from the wealth effect, especially for middle-class households (whose net worth is essentially based on real estate), could vanish. Compared with our central scenario, foreseeing growth at 3.3% and 2.8% in 2022 and 2023, respectively, we identify three scenarios that could push the U.S. economy into a technical recession: (i) a collapse of the US housing market following abrupt monetary tightening , (ii) a significantly weaker fiscal impulse due to spending cuts after the mid-term elections,  and (iii) a resurgence of the trade conflict between China and the US (resulting in a doubling of current US tariffs on imports from China (19%)).

However, some factors might be impairing the signalling quality of the yield curve inversion this time around. After all, unlike during the past recessions since the 1990s, the current inversion pattern comes at a time when the US economy is not in a clear overheating phase (and growth is in fact slowing). Headline inflation has reached record levels while the output gap is just about closing. Monetary tightening now starts from the nominal lower bound (0%) at which further accommodation is hardly possible, so the stance remains loose overall, with real rates still negative (even over the longer term). At the same time, corporate and household balance sheets have become less vulnerable to rising interest rates, thanks to rising cash buffers, higher net worth and reduced leverage. Thus, the yield curve flattening seems to reflect front-loaded and high inflation expectations due to a negative supply shock rather than a demand-driven deterioration of the economic outlook. For instance, the US inflation breakeven rate stands at 4.3% over the next two years, which is considerably higher than the market-implied expectations for next 10 years (2.9%).

However, we do think the window for a “soft landing” is narrowing.

Markets are still ambivalent about whether the current hiking cycle will result in either a “soft landing” or a “hard landing”. The “this is time is different” camp trusts in the Fed’s ability to hike rates just enough to keep inflation in check without killing growth (“soft landing”), which is most clearly reflected in the real yield curve. The “hike and cut” camp believes the aggressive increase of policy rates will reduce economic activity to an extent that a quick reversal of the monetary stance will be necessary (“hard landing”). This is particularly evident on the forward and future curves, where interest rate cuts are already being priced in for 2023 (Figure 4).

Figure 4: Implied change in policy rate (differences of EuroDollar-Futures, %)

Figure 4: Implied change in policy rate (differences of EuroDollar-Futures, %)
Sources: Refinitiv, Allianz Research
Figure 5: US—Neutral rate and policy rate expectations (%)
Sources: Refinitiv, Allianz Research.
Note: The green lines define the level at which the effective policy rate indicates a neutral monetary stance for an inflation target at 2 percent and a closed output gap.

We think that the window for a “soft landing” is becoming increasingly narrow. In the end, it will depend on how high the terminal value of the hiking cycle turns out to be and whether it is high enough to noticeably slow down the economy. The market-implied terminal rate is currently clearly above this threshold (Figure 5). Since the 1960s, such an overshoot has always been followed by a recession (except for 1994). At present, the Fed can (and should) raise the key rate to the neutral rate; however, tightening by more than 200bps-rate hikes (consistent with market expectation) to tame inflation, which is  deemed necessary by some FOMC members  , would also substantially increase the risk of a recession, raising critical trade-offs for the Fed along the way. However, a new equilibrium where higher yields, mortgage rates and inflation cause less of an economic slowdown could defy this historical logic. Given the currently still high level of uncertainty and the potential for significant structural changes affecting resource reallocation during the recovery phase, we would not be surprised to see a longer and deeper inversion of the US yield curve than in previous episodes.

We might soon reach the terminal rate, but it is too early to take a position.

The recent shift of the US yield curve dynamics to longer maturities suggests that the 10-year Treasuries could test the 3% mark over the next few weeks. The shift in Fed communication towards the reduction of its asset holdings (Quantitative Tightening, QT) has pushed up the 10y yield to 2.75%. While the long-term rates have room to increase further, we expect a gradual decline over the course of the year towards 2.25%-2.5% at year-end (Figure 6).

Figure 6: Fair value estimate for 10-year US Treasury yield

Figure 6: Fair value estimate for 10-year US Treasury yield
Sources: Refinitiv, Allianz Research
In case of a “soft landing”, inflation would be tamed, and long-term rates should fall as inflation risk is priced out. In case of a “hard landing”, a recession and rate cuts will be priced in, with long-term yields falling accordingly. QT will create some upward pressure on long-term yields as the Fed still extracts more than 1pp from long-term yields by containing the market supply of US Treasuries. Unless it switches to net sales, this stock effect will only phase in gradually over the next five to seven years. The underlying real neutral rate priced in the term structure of the yield curve is now close to the estimates based on macroeconomic variables. In the past, this pattern has always been a signal of a peak in long-term rates.