EXECUTIVE SUMMARY

  • The US housing market is adjusting to the new reality of higher-for-longer interest rates. Interest rates are rising rapidly – the Fed delivered a third consecutive 75bp hike during the September FOMC meeting – and unlikely to decrease much in 2023 as the FOMC will be keen to restore its inflation-fighting credibility. In this context, the pass-through from higher Fed Funds rates to mortgage rates today is the strongest since the early 1980s.
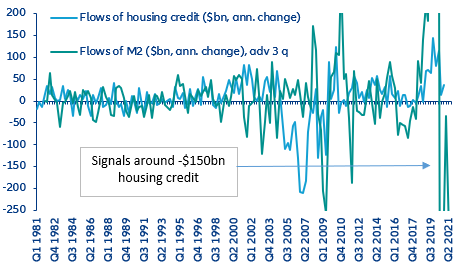
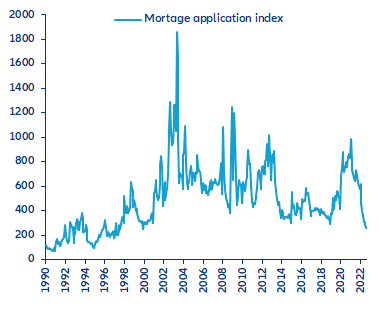
  • As a result, housing and mortgage markets have entered into a rapid correction phase. Mortgage applications have slumped to their lowest level in more than 20 years, while the stock of unsold homes is reaching historical highs, signs that housing demand is dropping rapidly. Meanwhile, a rapid slowdown in deposits and monetary indicators suggests that financial institutions could start pulling back mortgage lending availability soon.
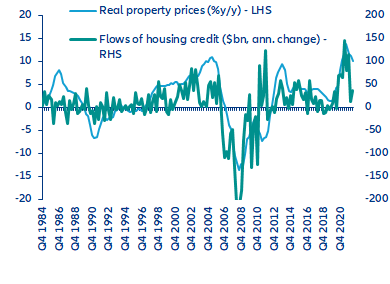
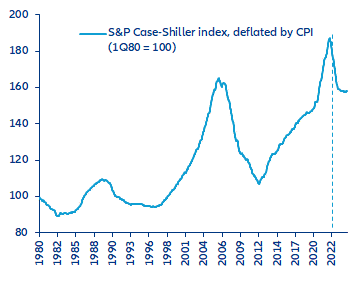
  • Property prices have held up thus far but are the next domino to fall: We expect real property prices to slump -15% within the next 12 months, which will push the US economy into a recession in 2023 (-0.7%). However, strong aggregate household balance sheets should soften the blow. Unlike in the mid-2000s, household balance sheets are in better shape – overall debt is much lower relative to incomes, the average credit quality of that debt is higher (sub-prime mortgages have declined), net worth is very high (reducing the likelihood that large swaths of households slip into negative equity) and cash balances remain significantly above pre-pandemic levels. 

The US housing market has entered into a sharp correction.

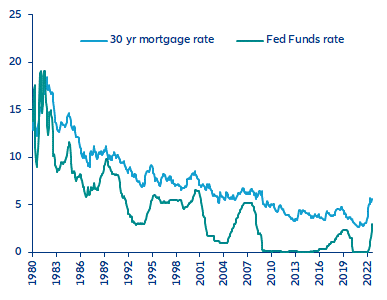
Mortgage rates are hitting the roof as the Federal Reserve tightens aggressively to cool off strong inflationary pressures. They started to increase abruptly as early as December 2021 when the Fed admitted that inflation was not transitory. By April 2022, the 30-year mortgage interest rate (the benchmark rate for most home mortgages) had shot up above 5%, compared to the all-time low of 2.7% reached in end-2020, and approached 6% by June 2022. It currently stands at around 5.7%. In fact, the current pass-through of Fed rates hikes into mortgage rates is stronger than that of any previous tightening cycle since the mid-1980s as markets expect the Fed to remain hawkish in the context of surging inflation (see Figure 1). Since the Fed pivot in December 2021, the average pass-through has been a little more than 100% (i.e. a 100bps increase in the Fed Funds rate translates into a bit more than 100bps increase in the mortgage rate) and is immediate.

Figure 1: Federal Funds & mortgage interest rates

Figure 12: Shipping sector average level of debt (USD mn)
Sources: Refinitiv, Freddie Mac, Allianz Research

Housing indicators are collapsing across the board. Housing is one of the sectors most sensitive to interest rates, so it is not surprising that monetary tightening is having a rapid and powerful effect on housing indicators. Increases in the costs of new mortgages reduce the affordability of house purchases and are thus directly hitting housing demand: Over the past 18 months, the mortgage application index has slipped to its lowest level in 23 years. Existing and new home sales have also declined rapidly since the beginning of this year, reversing the upward trend witnessed since the aftermath of the Global Financial Crisis (GFC) in 2008-09 (excluding a short-lived drop at the height of the pandemic).

Higher interest rates also increase interest payments on existing mortgages, though this channel is not very potent in the US since the share of variable-rate mortgages is very low (most households have locked in fixed interest rates on their mortgages).

Figure 2: New home sales and NAHB index

Figure 2: New home sales and NAHB index
Sources: Refinitiv, Freddie Mac, Allianz Research

Housing starts (i.e. construction on new housing) have started to fall recently and more declines are to be expected in the months ahead, according to the leading signals sent by home sales and the NAHB homebuilder confidence survey. The latter is declining at an abrupt pace, reaching its lowest level since 2014 in August (see Figure 2).  The housing market is now clearly oversupplied, with the ratio of unsold homes to new home sales almost as high as in 2008 (see Figure 3).

Figure 3: Monthly supply of new homes

Figure 3: Monthly supply of new homes
Sources: Refinitiv, Freddie Mac, Allianz Research

Residential investment was the weakest main spending component in the latest second-quarter GDP report, slumping by a hefty -4.3% q/q (-16.2% annualized) – the largest drop (excluding the pandemic-induced lockdown in Q2 2020) in over a decade.

Property prices are typically the last indicator to pull back in a downturn, and indeed real prices started to level off only in June after skyrocketing through the pandemic (+25% between February 2020 and June 2022). The combination of rising mortgage rates and property prices have resulted in a recent drop in housing affordability and scaled back plans to buy a new home (see Figure 4).

Figure 4: Housing affordability index and plans to buy a new home

Figure 4: Housing affordability index and plans to buy a new home
Sources: Refinitiv, Conference Board, National Association of Realtors, Allianz Research

A rapid slowdown in deposits and monetary indicators suggest that financial institutions could also start pulling back mortgage lending soon.

Macro policies drive the mortgage market. The Fed and the US federal government’s extremely loose macro policies rolled out through the pandemic largely contributed to prop up house prices through an increase in mortgage lending. In particular, the Fed targeted support for the housing market, even though it was not at the center of the crisis (in contrast to 2008-09), by purchasing USD1.35trn of residential mortgage-backed securities (RMBS) between February 2020 and May 2022. On the fiscal front, generous cash handouts to households contributed to boost cash holdings, deposits and credit, stimulating housing demand.  
Since 2021 and the surge in inflation, macro policies have turned decisively more restrictive. The Fed started to run down its balance sheet in June (at a faster pace than in the previous run-off episode of 2017-19), short-term interest rates are rising rapidly and fiscal consolidation is expected to carry on following the passage of the Inflation Reduction Act in Congress recently, albeit at a much more moderate pace next year.
The influence of macro policies on the mortgage market can be seen through the historical relationship between the monetary aggregate M2 (which combines deposit and retail money market funds) and financial institutions’ (banks and non-banks) housing lending to households. The annual change in the flows of M2 has led the annual change in the flows of housing credit by around three quarters historically (see Figure 5). Put simply, more deposits in the financial system enable financial institutions to ramp up lending.

Figure 5: Annual change in flows of M2 and housing lending

Figure 5: Annual change in flows of M2 and housing lending
Sources: Refinitiv, Allianz Research

The link between M2 and housing lending is far from being tight during some episodes. In particular, the relationship broke down during the GFC when financial institutions cut back lending, owing to their weak balance sheets and large disruptions in the financial system, despite a positive M2 impulse. Since the start of the pandemic, the change in the flows of M2 has been very volatile, dropping back sharply since Q2 2021 after an initial spike.

The pullback in M2 is being driven by the overall contraction in the policy-driven monetary base M0.  Money growth is being weighed down by the surge in short-term interest rates, which has increased the opportunity costs of holding funds in low and non-interest-bearing deposit accounts (the M1 aggregate), reducing funds available for financial institutions to increase lending. This should lead to a significant pullback in mortgage credit flows within the next 12 months or so (Figure 5). M2 flows imply that the flows of housing credit are likely to decline to around -USD150bn by Q3 2023, much less than during the previous GFC downturn. However, there are high uncertainties, given the sharp swings in M2 flows.

Figure 6: Real property prices and housing credit

Figure 6: Real property prices and housing credit
Sources: Refinitiv, Allianz Research

It is also important to note that banks account now for less of the mortgage business than non-bank financial institutions (NFBIs). NFBIs are subject to less regulatory oversight, less capitalized, do not have access to liquidity at the Fed’s discount windows and are more exposed to non-government-backed mortgage loans, leaving them potentially more vulnerable to the unfolding housing market correction. Several non-bank mortgage lenders have already started to go out of business since the summer as they struggle with a slump in mortgage application volume (see Figure 7) and a drying up of funding.

Figure 7: Mortgage application index

Figure 7: Mortgage application index
Sources: Refinitiv, Mortgage Bankers Association of America, Allianz Research

Real property prices to fall by -15% in next 12 months, according to lending data and the stock market.

In this context, we expect real property-prices growth to dip at a fast clip before long, down -15% y/y from May 2022 (the peak) to September 2023, though the decline will be shallower than that seen during and in the wake of the GFC. We expect an acceleration of m/m declines in the next couple of months (see Figure 8 for our forecasts through December 2024). In nominal terms, the fall would be around -12%.  

Figure 8: Real property prices index forecast

Figure 8: Real property prices index forecast
Sources: Refinitiv, Allianz Research

To back up our property price forecast call, we also look at signals sent by the stock market via the perceived return on the S&P 500 home builder index and the perceived rate of appreciation of the Case Shiller property price index, which are closely linked (see Figure 9). The former leads the latter by nine months.

Figure 9: Homebuilder index perceived return and Case Shiller perceived rate of appreciation

Figure 9: Homebuilder index perceived return and Case Shiller perceived rate of appreciation
Sources: Refinitiv, Allianz Research

We calculate by how much property prices would need to fall so that the perceived rate of appreciation on the Case Shiller index reflects the drop in the perceived return on the S&P 500 home builder index. The perceived rate of appreciation of the Case Shiller index should fall from 6% to 4.2% over the next nine months. For this to happen, the Case Shiller index would have to fall by about -13% in nominal terms over the same period. This is very close to our expected -12% decline over the next 12 months.

One cannot rule out a further decline in the perceived return of the S&P home builders index. In almost two cases out of three, the perceived return on the S&P home builders index has indeed been lower than its current level. Put differently, there is downside risks to our property prices forecast.

What does this mean for the US economy?

Property prices are a key driver of the US business cycle. Residential investment has a small impact on GDP: We expect it to dip by -6.3% this year and another -6.4% next year, but that would knock only 0.2pp off GDP growth annually. However, property prices have a much more potent effect.

In order to capture the GDP effect of the unfolding house-price correction, we build a simple financial condition index (FCI) using GDP, 10-year corporate bond yields (investment grade) and real property prices. In other words, our FCI simply captures asset prices (house prices) and borrowing costs (corporate bond yield) and their relations to GDP growth. We did not include real equity prices as we find relatively little direct effect on GDP. We also do not include the tools of monetary policy, i.e. the Fed Funds rate and the Fed’s balance sheet, because they affect the economy more indirectly and mostly operate through asset prices and longer-term borrowing costs, which we already factor in.

Asset prices affect the economy through wealth effects (lower asset prices prompt households and corporates to spend less) and through the credit channel. The latter represents credit availability, determined by lenders (financial institutions). Credit availability amplifies economic shocks during downturns: the cost of borrowing may decrease as monetary policy is loosened, but the availability of credit may be tightened, potentially leading to a credit crunch. During downturns or periods of monetary tightening, declining asset prices pull down collateral values, which prompts banks to tighten credit standards. Real property prices and credit standards on mortgage loans somehow move in tandem (see Figure 10). The impact on the real economy is also felt through property developers going bankrupt or cutting back projects and laying off employees.

Figure 10: Real house prices and credit availability on housing loans

Figure 10: Real house prices and credit availability on housing loans
Sources: Refinitiv, Allianz Research

Figure 11 shows that real property prices boosted GDP growth by around 1pp per year in the early 2000s, and close to a whopping 2pp from end 2021 to Q2 2022. This tallies with the evidence of a powerful credit channel:  Property – as households’ biggest asset pledge against credit – is a key driver of the US financial and business cycle.

Figure 11: FCI (pp) & GDP growth (% y/y)

Figure 11: FCI (pp) & GDP growth (% y/y)
Sources: Refinitiv, Allianz Research

Accordingly, declining house prices could knock up to 1.7pp off GDP by early 2024, adding risks for a more long-lasting recession. Because the impact of financial conditions on GDP comes with a lag, higher corporate borrowing costs since early 2021 only started to knock GDP on a q/q sequential basis since the end of 2021 (see Figure 11). Assuming corporate interest rates remain at their current level of around 4.3%, they would knock quarterly GDP by around 0.7pp (non-annualized) in Q3 and Q4 2022, and by up to -2pp in y/y terms by the first half of 2023.

Penciling in our property-price forecasts into our FCI, we find that lower house prices should start to hit GDP on a sequential q/q basis from Q2 2023, by around 0.4-0.5pp from Q3 2023 to Q1 2024. On a y/y basis, they will drag GDP growth down by up to -1.7pp by early 2024.

Figure 12: GDP q/q growth and contributions (non-annualized)

Figure 12: GDP q/q growth and contributions (non-annualized)
Sources: Refinitiv, Allianz Research

These results are broadly in line with our latest GDP forecasts, though they are adding downside risks to our already below-consensus call of a -0.7% US recession in 2023. Higher interest rates are already starting to drag down GDP and their contribution should turn sharply negative on a y/y basis in the next couple of quarters, consistent with our forecast of a recession starting as early as Q4 2022.

We expect GDP to start recovering from the second half of 2023, but at a relatively sluggish pace, with activity and spending weighed down by the property price downturn. However, the recession could be more long-lasting, or the recovery more muted, than we are currently expecting since the drag from house prices should reach its maximum in early 2024. Furthermore, while we expect corporate borrowing costs to retreat by the end of 2023 – consistent with our view that the Fed will cut interest rates by 100bp from June 2023 – they should remain at a relatively high level of 4.2% (barely lower than today).

However, there are some factors of resilience that should soften the blow: First, macro-financial imbalances today are much less present than during the run-up to the GFC. Unlike in the mid-2000s, household balance sheets are in better shape – overall debt is much lower relative to aggregate disposable income, the average credit quality of that debt is higher (sub-prime mortgages have declined), net worth is very high (reducing the likelihood that large swaths of households slip into negative equity) and cash balances remain significantly above pre-pandemic levels. Therefore, the surge in borrowing costs should be manageable for households’ finances.

Furthermore, inflation has started to pull back since July and we expect more declines in the months ahead, which should bring some reprieve for households’ income. Finally, banks have built healthier balance sheets (partly the result of tighter regulation post-GFC), making them more able to absorb losses without going bust or requiring bailouts. In all, strong household balance sheets underpin our expectation of a shallow drop in consumer spending in 2023 (-0.1% vs -0.9% during the GFC).

Figure 13: Households’ finances

Figure 13: Households’ finances
Sources: Refinitiv, Allianz Research