What drives the ECB? An Augmented Taylor Rule for the Eurozone

What drives the ECB? An Augmented Taylor Rule for the Eurozone

December 12 2019

Executive Summary

  • Price stability: Half of the ECB story? The European Central Bank’s primary task is the pursuit of price stability, which is defined as inflation rates below, but close to, 2% over the medium term. Our analysis shows that inflation and output gap considerations explain half of the ECB’s monetary policy stance over the past decade. However, from 2016 onwards, output and inflation gap measures alone struggle to explain the ECB’s increasingly accommodative monetary policy stance in a standard Taylor Rule.
  • The rise of implicit targets. To test the importance of other motives, we ran selected augmented Taylor Rules, adding explanatory variables and looking at their contributions over time to explain the ECB’s policy stance. Sovereign risk premia, financial stress and volatility indicators, measures of economic policy uncertainty and banks’ stock market performance all appeared relevant to the ECB’s decision-making over the past ten years. Their significance, especially in the case of peripheral spreads and financial stress indicators, peaked at the time of the Euro sovereign debt crisis.
  • Inflation matters (again): From 2018 onwards, inflation has made a comeback in explaining most of the accommodative monetary policy stance. However, our results suggest that banks’ stock prices continue to feature high on the ECB dashboard in recent years, especially when compared to other stress indicators.

Introduction

For the past 20 years, the ECB has been responsible for setting a single monetary policy for the Eurozone. In this context, its primary objective – as laid out in the Treaty on the Functioning of the European Union, Article 127 (1) – is to maintain price stability, which has been defined as inflation rates below, but close to, 2% over the medium term. Beyond that, the ECB – "without prejudice to the objective of price stability" – is also tasked with supporting general EU economic policies with a view to contribute to objectives such as sustainable growth and high employment. Meanwhile, financial stability is not an explicit ECB objective. Instead, the Treatise attributed only a limited, contributory role to the ECB in that regard (ECB, 2018). While the hierarchy of priorities is hence set, the weight to be given to other considerations that go beyond price stability remains unclear. In other words: To what degree has the ECB’s monetary policy stance been driven by inflation considerations on the one hand and financial stability considerations on the other hand? In this paper, we hope to shed some light on this question. In particular, we want to find out whether the focus has shifted as a result of the Eurozone debt crisi

Estimating an augmented Taylor Rule for the ECB

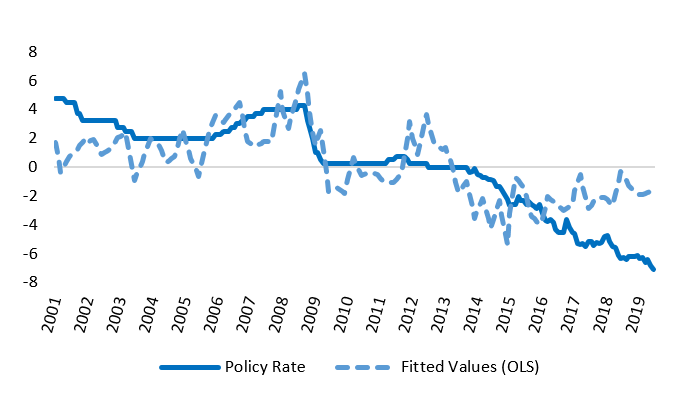
Before we can estimate a monetary policy reaction function, we first require an indicator that describes how tight or loose monetary policy has been over time. However, measuring the effective stance of monetary policy has become more complicated in recent years. After all, as the ECB ran into the zero lower bound on short-term interest rates in 2013 and increasingly resorted to unconventional policy measures, the main policy rate no longer accurately reflected the overall monetary policy stance. To construct an unconstrained measure of the overall stance of ECB monetary policy, we use the ECB’s main policy rate until September 2013 only.  Thereafter, we switch to a shadow rate estimate from Wu and Xia (2016) that also reflects unconventional policy measures such as negative rates, explicit forward guidance and asset purchases. Figure 1 shows the combined time series of the ECB main policy rate and the shadow rate. As can be seen, our constructed proxy of the monetary policy stance is not constrained by a zero lower bound. In fact, ever looser monetary policy in recent years has seen the shadow rate drop below -7%.

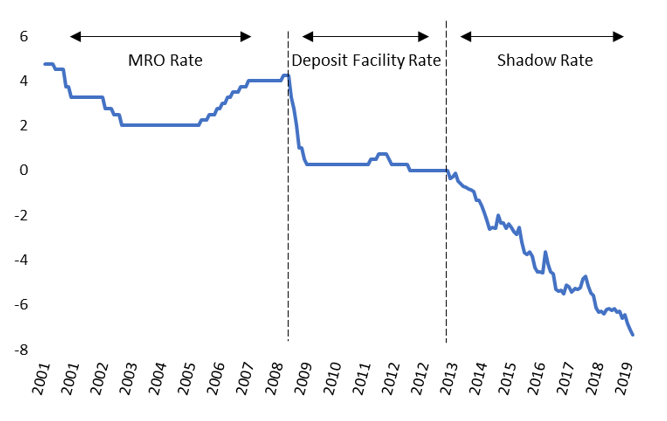
 
 
Figure 1: Measure of Eurozone Monetary Policy Stance over time, in %
Sources: Datastream, Allianz Research
Equipped with our measure for the overall monetary policy stance in the Eurozone, we can now estimate our baseline monetary policy reaction function. We use a version of the Taylor rule, which suggests the monetary policy stance can be explained by a constant plus a weighted sum of the deviation of inflation from target (inflation gap) and output from potential (output gap).  Figure 2 plots fitted values and residuals from an OLS regression of our monetary policy measure on the constant, the inflation and the output gap. The standard Taylor rule largely provides an accurate description of the ECB’s monetary policy stance.
Figure 2: OLS – Actual and Fitted Values
Sources: Datastream, Allianz Research

However, from 2016 onwards it fails to capture the ongoing sharp decline in the shadow rate. Whereas the actual shadow rate falls much lower, the Taylor rule suggests only slightly negative rates. While inflation and output gap considerations are overall useful at explaining the ECB monetary policy stance over the past 20 years, output and inflation gap measures struggle to explain the ECB’s increasingly more accommodative monetary policy stance from 2016 onwards. These findings provide us with an incentive to shed more light on what other factors have been driving monetary policy over the past four years.

ECB monetary policy objectives: Shifting priorities

In order to test for ulterior considerations beyond price stability, we supplement our baseline model with different explanatory variables. We choose the variables specifically to test to what extent the ECB’s monetary policy stance can be explained by financial stability concerns.

  • First, we include the VSTOXX as a measure of stock market volatility. Equivalent to the famous VIX for the S&P 500, the VSTOXX extracts option-implied volatility from the EURO STOXX 50.
  • To account for systemic risks arising from movements across financial markets, we also consider the Country-Level Index of Financial Stress (CLIFS).
  • To test to what extent the ECB takes into consideration “Italian risk” when setting its monetary policy, we add the difference in the yield on Italian vs German 10-year government bonds.
  • We include a bank equity index (DJ EURO STOXX Banks) to measure to which extent the ECB has responded to concerns about the state of the European banking sector.
  • Lastly, the ECB may have felt the need to support the economy through an accommodative monetary policy stance during times of high policy uncertainty. Therefore, we also consider an EU Policy Uncertainty index to account for changes in political risk.

We use a time-varying parameter model in the style of Strohsal et al. (2016) to estimate the augmented Taylor Rules. We suggest that the weights attributed to the respective variables may have changed over time, particularly due to impactful events such as the Great Financial Crisis and the Eurozone sovereign debt crisis. Therefore, allowing for time-varying coefficients can provide more insightful results than standard OLS, which implies that the ECB assigned the same weight to the measure from 2001 until 2019. Constant coefficients do not allow for potential changes in the relative importance of different factors over time.  We may expect that while the ECB had to pay relatively little attention to financial stability considerations before the financial crisis, its focus on stability measures increased considerably in the more recent past.

The results are presented below. For each variable included as an alternative determinant of the monetary policy stance, we report the contribution of that variable to the fitted value in each month from the respective estimation with time-varying parameters.

VSTOXX: To what degree can ECB policy be explained by efforts to suppress equity market volatility?

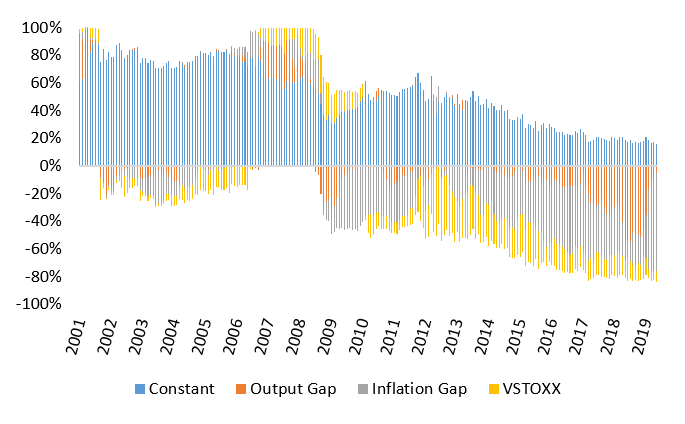
When including the VSTOXX as an additional variable, much of the variation in the policy/shadow rate throughout the entire sample is explained by the constant. This effect is particularly strong for the pre-crisis subsample. Since we have not defined underlying economic dynamics for the constant, the interpretation of this term is difficult. However, as we have not included the equilibrium real interest rate, which is a standard component of the Taylor rule, we may conjecture that the constant at least partly picks up the effect of the omitted real rate .
The further loosening of the monetary policy stance in the period between the financial crisis and the European sovereign debt crisis was mostly driven by the inflation gap. In 2010, the effects of the VSTOXX on the monetary policy stance changed sign from positive to negative.

Figure 3: VSTOXX - Individual contributions
Sources: Datastream, Allianz Research
This is due to a steep fall of the coefficient attached to the VSTOXX from positive to negative territory from February to May 2010. The contribution of the VSTOXX was particularly strong during the European sovereign debt crisis, when the coefficient fell sharply again and the uncertainty index rose strongly: Up to 50% of the level of the shadow rate was determined by considerations related to stock market volatility. Following the Euro crisis, the effects of the VSTOXX decrease in importance but still make up an economically significant share of 15-20% of the shadow rate. Over the past two years, it appears that the inflation gap has had an increasing effect, explaining up to 50% of the level of the shadow rate during some months in 2018. This “comeback” of the inflation target is apparent in all of our regressions and largely explained by a sharp rise in the associated coefficient. In 2018 and 2019, we find the VSTOXX to explain less than 5% of the level of the shadow rate.

CLIFS: To what degree can ECB policy be explained by efforts to keep a lid on financial stress?

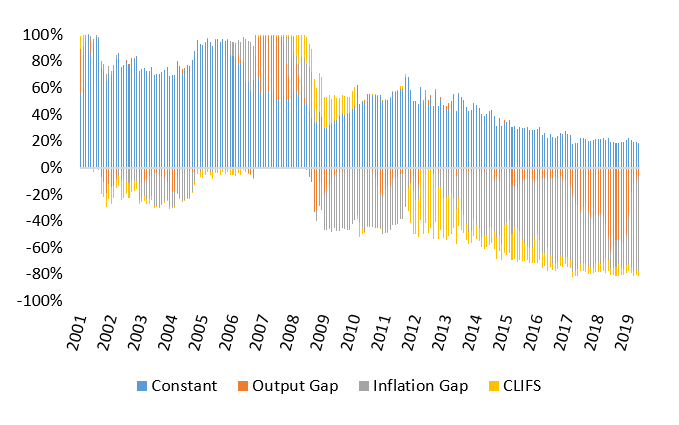
We also test the Country-Level Index of Financial Stress (CLIFS). This index provides a more holistic market-based measure of financial market stability than the VSTOXX as it considers equity, bond and foreign-exchange markets as well as co-movements between these markets to capture systemic risk. While the concept of the CLIFS was introduced as recently as 2015, we use it as a proxy for cross-market financial stability considerations of the ECB in general for the entire sample period.
Figure 4: CLIFS - Individual contributions
Sources: Datastream, Allianz Research
Similar to the VSTOXX, the attached coefficient falls sharply in early 2010 and 2012. Interestingly, the coefficient also fell strongly during the early 2000s, which was not the case for the VSTOXX. As can be seen in Figure 4, the CLIFS contributed significantly to movements in the policy/shadow rate during the Great Financial Crisis and the European debt crisis, two periods which were characterized by severe systematic financial stress. While the attached coefficient becomes increasingly negative, thus signaling a stronger consideration of systemic financial risk over time, the overall effect on the monetary policy stance gets weaker after the sovereign debt crisis. Since 2016, explained shares range largely below 5%. In contrast, the inflation gap accounts for almost 75% of the shadow rate after 2018, which implies the largest role for inflation over the entire sample.
We see that the inflation gap seems to pick up the entire difference in the explained share between CLIFS and VSTOXX, while the output gap and the constant explain virtually the same proportion of the policy stance as before. We conclude that the ECB seems to set its monetary policy with systemic risk in financial markets in mind during financial crisis periods but that the recent period of monetary stimulus is mostly driven by alternative factors.

Italian 10yr sovereign bond spreads: To what degree can ECB policy be explained by efforts to stave off an Italian debt crisis?


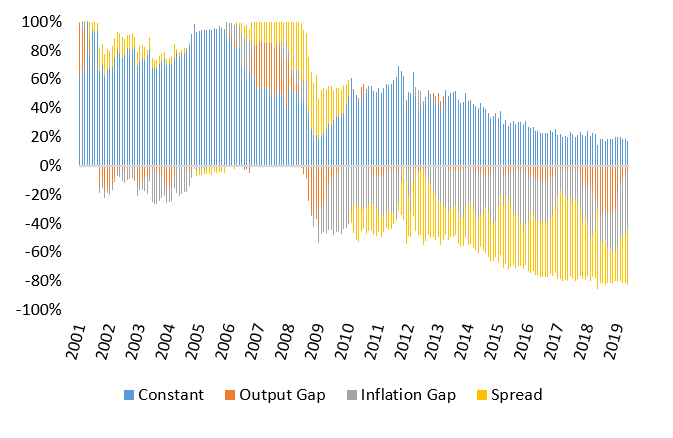
We find that bond spreads account for a both statistically and economically significant share of the level of the policy/shadow rate. This is particularly true for the time after the Great Financial Crisis. The importance of the spread increases over the post-crisis subsample. The spread accounts for close to 60% of the monetary policy stance in 2017 and its relative contribution remains clearly elevated in 2019. This contrasts this measure from the VSTOXX and CLIFS.
Figure 5: Italian 10yr sovereign bond spreads – Individual contributions
Sources: Datastream, Allianz Research
In comparison to the base scenario, including the sovereign spread leaves explained proportions from the constant and the output gap virtually unchanged but reduces the size of the relative contribution from the inflation gap significantly. We may interpret this result as the ECB attaching less weight to its inflation target to address Italian sovereign debt concerns instead.

Euro Bank Equity index: To what degree can ECB policy be explained by efforts to calm concerns about the state of the Eurozone banking sector?

We analyze this question by including the DJ EURO STOXX Banks index as an additional explanatory variable. We find the bank equity price index to contribute in a both statistically and economically significant manner to the monetary policy stance over almost the entire sample. Interestingly, however, bank equity considerations seem to have had a negligible influence on the policy rate during the 2008/2009 financial crisis. This may be the case since bank stocks retreated on a global scale, implying that concerns were driven by a general loss in confidence in the financial system and not idiosyncratic European banking sector weakness.

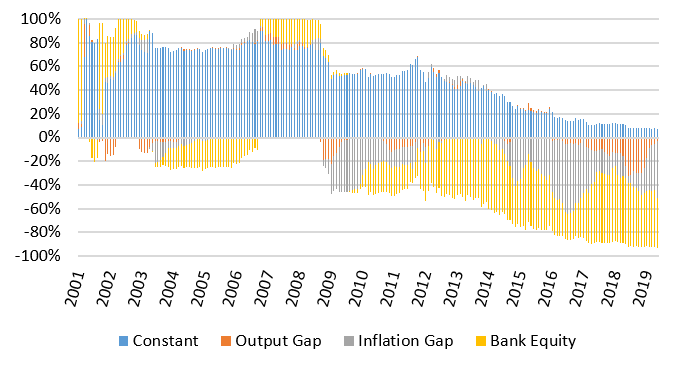
Following the Great Financial Crisis, the decreases in the policy and shadow rate are strongly accounted for by the movements in the equity index, with shares varying between 20% and 60%. Notably, the explained share remains at around 50% during the 2018/2019 period.

In contrast to the case of the VSTOXX and CLIFS – and similar to the estimation with the bond spread – the role of the inflation gap in determining the monetary policy stance seems to be smaller than that of bank equity considerations over the last two years. Hence, the ECB’s unconventional monetary policy decisions seem to have been particularly driven by such alternative objectives. This may provide support for theories that saw the ECB pursue a monetary policy aimed at propping up the banking sector under former ECB president Mario Draghi.
Figure 6: DJ EURO STOXX Banks index – Individual contributions
Sources: Datastream, Allianz Research
EU Policy Uncertainty: To what degree can ECB policy be explained by efforts to make up for elevated policy uncertainty?

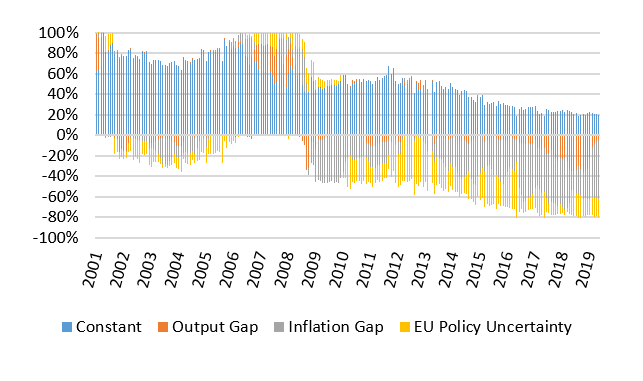
Lastly , we also include the EU Economic Policy Uncertainty Index. This index measures uncertainty about economic policy based on newspaper articles from France, Germany, Italy, Spain and the United Kingdom. We find a similar pattern as in the case of the VSTOXX. Especially during the Euro crisis, the contribution to the monetary policy stance reaches almost 60%. It is also worth noting that the period of the Eurocrisis stands out as a time during which the inflation and output gap seemed to have had very little influence on the setting of the ECB’s monetary policy measures. Nevertheless, the inflation gap accounts for around 50% of the expansionary monetary policy stance during 2016 and the 2018/2019 period. While the constant and the output gap have a negligible effect, policy uncertainty is strongly associated with the policy stance over the entire post-Euro crisis period, also the post-2016 years.
Figure 7: EU Policy Uncertainty – Individual contributions
Sources: Datastream, Allianz Research
Focus on Eurozone banks

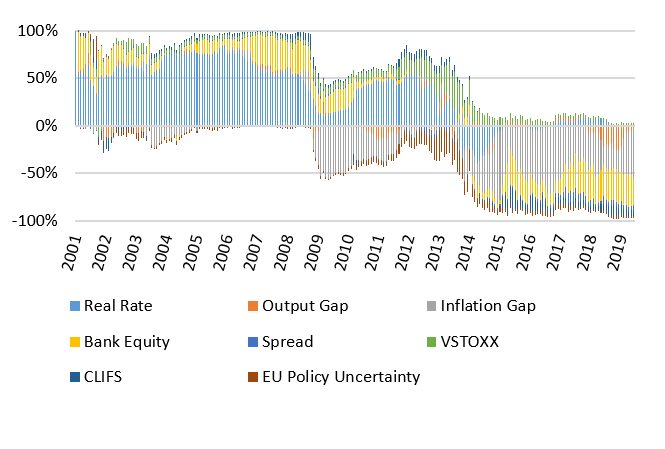
Finally, augmenting our Taylor rule with all variables simultaneously confirms the initial results. Next to the inflation gap, movements in the Euro Bank Equity index best explain the ever more expansive ECB policy stance in the aftermath of the Eurozone sovereign debt crisis.
Figure 8: All variables – individual contributions
Sources: Datastream, Allianz Research
Chief Economist
Ludovic joined Euler Hermes as Chief Economist in 2011. He also heads macroeconomic and thematic research for Allianz SE globally since 2017. Ludovic sits on the Board of Directors of Solunion, Euler Hermes’ joint venture company for Spain and Latin America.
Research Assistant
Senior Economist for Europe