EXECUTIVE SUMMARY

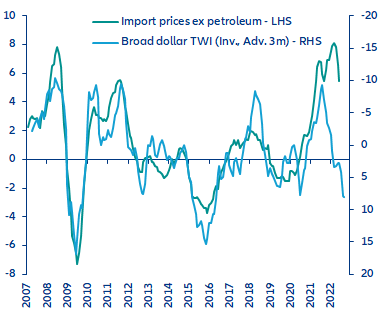
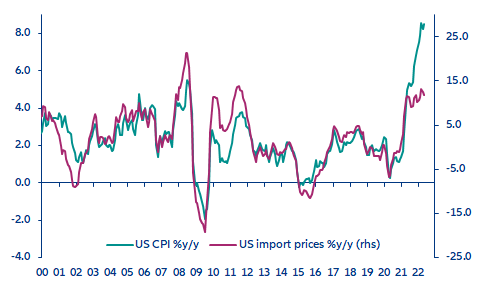
  • A stronger US dollar will not be enough to rein in inflation in the US. Even as the appreciation of the USD will reduce inflation by -1.4pp in the next three months, and the US is less exposed to surging energy prices, we still expect inflation to remain well above 2% next year. In this context, the Biden Administration is considering lifting some of the tariffs imposed on China during the Trump era, and stepping up efforts to strengthen supply chains.
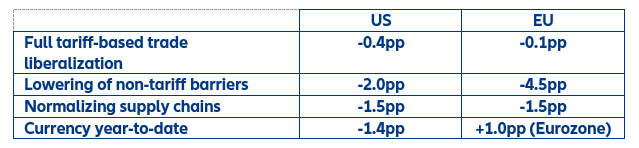
  • However, we find that even a full tariff-based trade liberalization in the US and the EU would not be a game-changer for the inflation outlook. If tariff rates on the main import partners (including China) were shaved to zero, inflation would be reduced by just -0.4pp in the US and -0.1pp in the EU, given the high share of duty-free imports (72% in the US on non-agricultural goods, 56% in the EU) already in place.
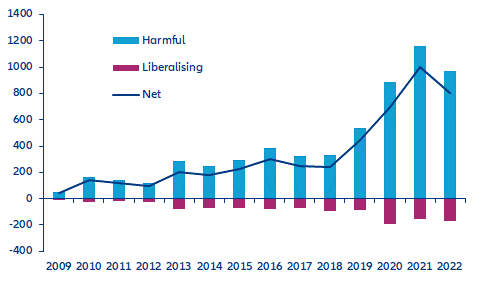
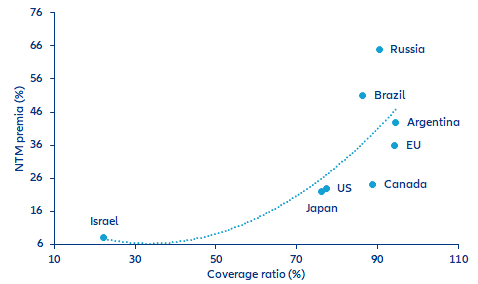
  • In contrast, lowering non-tariff barriers to trade would have a material impact. In the US, close to 80% of trade is affected by non-tariff measures, while in the EU it is close to 95%. We find that reducing non-tariff measures to trade to below 50% would lower corporate markups and in turn knock at least -2pp off inflation in the US and -4.5pp in the EU. Lowering protection for local producers could thus yield sizeable benefits for consumers, especially in the EU, where the -9% depreciation of the EUR will push up inflation by more than +1.0pp after one year.
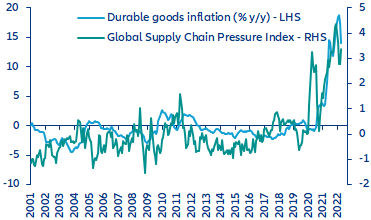
  • Easing supply-chain disruptions could also lower inflation by up to -1.5pp in both the US and the EU, according to our estimates. This would require normalizing industrial output and trade flows among key import partners in a context where China is likely to maintain its zero-Covid policy through Q2 2023. Separately, domestic policies could help, such as an infrastructure plan focused on ports and/or increasing competition in the shipping industry, accompanied by appropriate labor market policies.

Table 1: Impact of trade-related policy measures on inflation

Table 1: Impact of trade-related policy measures on inflation
Source: Allianz Research

Trade liberalization is back on the agenda.

Even as the appreciation of the USD will reduce inflation by -1.4pp in the next three months via reduced import prices (see Figure 1), and the US is less exposed to surging energy prices, we still expect inflation to remain above its pre-pandemic level through at least the first half of 2023. This persistently high inflation has heightened policymakers’ concerns about its increasingly visible costs on the economy and growing public discontent. In this context, the US Administration is considering lifting some of the Trump-era tariffs imposed on Chinese goods. This follows a mandatory four-year review of the tariffs, which could result in their expiry in July and August. Rolling back some of the tariffs imposed on Chinese imported goods is seen as a way to ease the cost of living crisis on households by softening consumer prices of goods.

Figure 1: US import prices and broad dollar index

Figure 1: US import prices and broad dollar index
Sources: US BLS, BIS, Allianz Research
The aggregate US tariff rate could decline by up to -2.5pp if the administration slashes to zero all bilateral tariff rates applied on its nine largest import partners (which together represent around 75% of US imports). Looking at the applied (effective) tariff rate, i.e. factoring in the structure of imported goods, the applied tariff rate on China stands at 12.8%, well above the most-favored nation tariff rate (MFN rate) of 1.5%, which would apply in the absence of retaliatory tariffs within the World Trade Organization (WTO) framework (see Figure 2). At 1.6%, the applied tariff rate on Indian goods is also higher than the MFN rate (0.7%) since the Trump-era retaliatory tariffs levied on Indian steel and aluminum have not been waived. On all the other large import partners, the applied tariff rates are very low and aligned with the MFN rates. Tariffs on Canadian and Mexican goods are non-existent since both countries trade within a zero-tariff customs union with the US (the USMCA, which has substituted the NAFTA agreement since 2020). If the US opts to reduce the tariff rates on Chinese and Indian goods to their MFN levels, the aggregate (total world) applied US tariff rate would fall by -2pp.

Figure 2: Tariff rates applied by the US on top import partners (%)
Sources: WTO, PIIE, Allianz Research / *Mexico and Canada not displayed (tariffs at 0)

In the EU, there has been less emphasis on trade liberalization as a potential means of easing soaring inflation, owing to the fact that trade tariffs on imported goods are already very low, reducing the scope for action in that area. The aggregate EU tariff rate could decline by only up to -0.4pp as six of the nine largest EU import partners are already operating under a Free Trade Agreement (FTA) or a customs union (the UK, Switzerland, Turkey, Japan, Norway and South Korea), with zero or close to zero tariff rates applied. Even in the three countries with which the EU does not have a free-trade agreement (China, India and the US), the applied tariff rates are fairly low, ranging from 0.5% for US imports to 1.8% for Indian imports (see Figure 3).

Figure 3: Tariff rates applied by the EU on top import partners (%)

Figure 3: Tariff rates applied by the EU on top import partners (%)
Sources: WTO, European Commission, Allianz Research

Even ambitious tariff cuts would (almost) not be effective to lower inflation. We assess the impact on consumer price inflation under the ‘extreme’ scenario of 0% tariff rate on main import partners by simply looking at the historical relationship between import prices and consumer prices (see Figure 4 for the US). The -2.5pp maximum reduction in the tariff rate in the US would shave -0.4pp off inflation while in the EU the -0.4pp reduction would shave -0.1pp off inflation. That is, even under an implausibly ambitious scenario of an elimination of tariff rates, the US and the EU would reap close to zero benefits in terms of lower inflation.

Figure 4: US import prices and inflation (%y/y)

Figure 4: US import prices and inflation (%y/y)
Sources: US BLS, Allianz Research

Removing non-tariff measures (NTMs) could have a material impact.

There has been an increasing number of non-tariff measures adopted in recent years (see Figure 5), including quotas on imports, export restrictions of key raw materials or essential goods, burdensome paperwork and red tape (which have added considerable friction to trade between the EU and the UK following Brexit) and, more broadly, regulatory requirements. At the global level, the goods most affected by NTMs are cars, steel products and telephones. The US is particularly active against steel products, constituting one third of global NTMs in that area. In Europe, NTMs are most frequently found against goods in the chemicals and agrifood sectors, with trade licensing requirements or bans sometimes in place. A study by Aston University found requirements surrounding EU health and safety standards for products such as food and chemicals, and technical specifications for machinery have been the most detrimental to UK exports to the EU. These NTMs alone would have reduced exports by 15% relative to a non-Brexit scenario.

Figure 5: Non-tariff trade intervention measures

Figure 5: Non-tariff trade intervention measures
Sources: Global Trade Alert, Allianz Research

In the US and EU, the share of imports covered by NTMs is well above the global level of 72%: 77% in the US and a whopping 94% in the EU. Much like tariffs, the presence of NTMs translates into higher price premiums (or mark-ups) on domestically-produced goods (as they are NTM-protected) as well as on imported goods (as they are subject to NTMs). A study by Dean et al.  quantifies these price premiums for a large set of consumer goods (grouped into four sectors) for more than 60 countries. These estimated NTM-induced premia are, as expected, higher in countries with high coverage ratios (see Figure 6). In the EU, the NTM premia reaches 36%. In contrast, the very open economy of Israel, which has a coverage ratio of only 22%, displays a premium of only 8%. The relationship between NTM price premia and the coverage ratio is seemingly exponential, with price premia rising sharply once the coverage ratio goes beyond 80%.

Figure 6: Coverage ratio of NTMs and NTM-induced premium on goods

Figure 6: Coverage ratio of NTMs and NTM-induced premium on goods
Sources: World Integrated Trade Solution, Dean et al., Allianz Research

If NTMs are lowered to Israel’s level, we find that the US CPI could fall by -2pp and the EU CPI by -4.5pp. Removing NTMs could be particularly useful in the Eurozone as the over -9% depreciation of the EUR is expected to push Eurozone inflation up by more than +1.0pp after one year through a rise of more than +6pp in import prices, according to the ECB’s estimates of exchange rate pass-through.

Under such a scenario – which conceivably could be achieved by lowering the coverage ratio below 50% – the mark-up of imported goods would fall to 8%. Weighing the fall in mark-ups by the coverage ratio (i.e. the share of imported goods that would see their mark-up drop) gives us an estimated import price impact, and, ultimately, a CPI impact. Note that these estimates are conservative: one may also expect the price of domestically produced goods to fall (not just imported goods affected by NTMs) as barriers to trade are removed and domestic competition increases.

Normalizing supply chains could also shave up to around -1.5pp off inflation in the US and the EU.

Much of the initial pick-up in inflation throughout the pandemic was due to the dislocation of global manufacturing supply chains (see Figure 7) amid a re-orientation of spending towards goods and disruptions to the supply of key materials (notably from Asia and China). We estimate that fully normalizing supply chains could lead to a -1.5pp decline in the CPI in the US and the EU. This assumes a more balanced situation in terms of input availability, as well as improving suppliers’ delivery times. This requires normalizing industrial output and trade flows among key import partners, in particular in China, where the continuation of the zero-Covid policy through Q2 2023 means continued risks for the functioning of global supply chains and global shipping. Separately, domestic policies in the US and the EU such as an infrastructure plan focused on ports and/or increasing competition in the shipping industry could help with easing supply-chain disruptions.

Figure 7: Global Supply Chain Pressure Index & US durables inflation

Figure 7: Global Supply Chain Pressure Index & US durables inflation
Sources: Refinitiv, Allianz Research

However, a strengthening of supply chains through high infrastructure spending must be accompanied by appropriate labor market policies. Policymakers have put forward ambitious investment plans to bolster the supply-side of the economy in the wake of the pandemic, such as the European Resilience and Recovery Facility (ERRF) in the EU or the Build Back Better (BBB) scheme in the US. However, the completion of the physical infrastructure projects (such as ports) is likely to be hampered by the acute shortages of labor and materials (see Figure 8), if not accompanied by appropriately-designed labor market policies (e.g. more flexibility in labor regulations to facilitate resource allocation, more flexibility in visa requirements to reduce job vacancies, temporary flexibility for entry in restricted professions and expansion of vocational training). Supply shortages have been holding back the construction of new housing in the US, where the number of building permits issues where construction has not yet started is at record high (at around 385,000).

Figure 8: Factors limiting manufacturing production in the Eurozone (% of firms surveyed)

Figure 8: Factors limiting manufacturing production in the Eurozone (% of firms surveyed)
Sources: European Commission, Allianz Research