Gender pay gaps in Europe

#IWD: Employ and pay them more!

March 2023
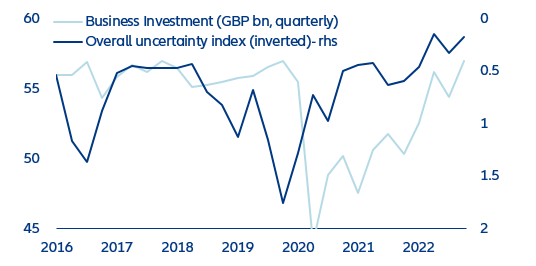
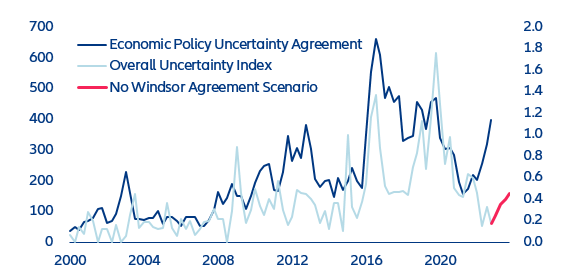
  • Windsor Framework to the economic rescue – The lifted uncertainty could be sparing the UK economy 2.5% of business investment and a third of a GDP point in 2023-24.
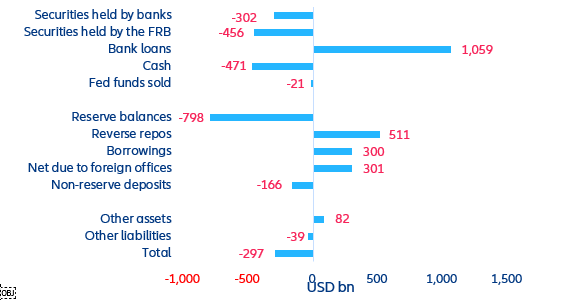
  • US monetary aggregates – The Swan song? Since March 2022, US money supply has contracted; the last time this happened was during the Great Depression.
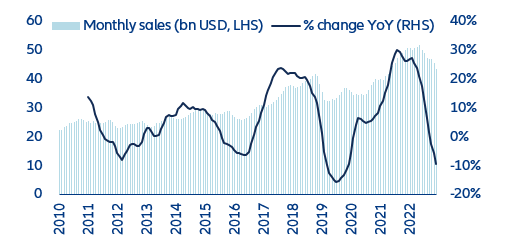
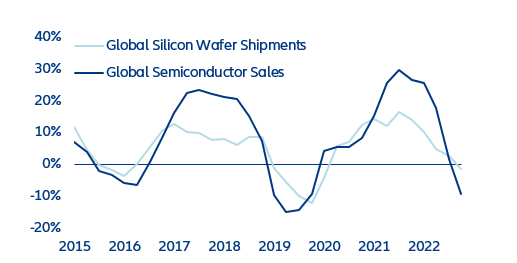
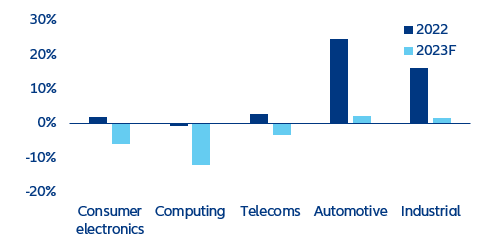
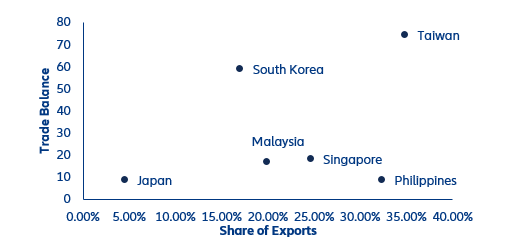
  • Semiconductors – The end of the great chip shortage? The good and the bad of the 2023 semiconductor recession.

In focus – International Women's Day: Employ and pay them more!

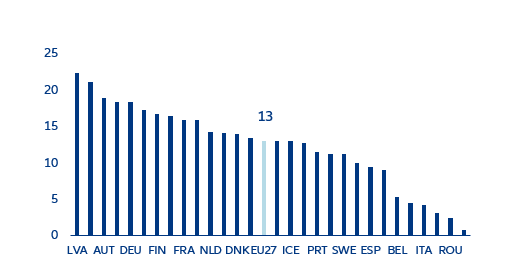
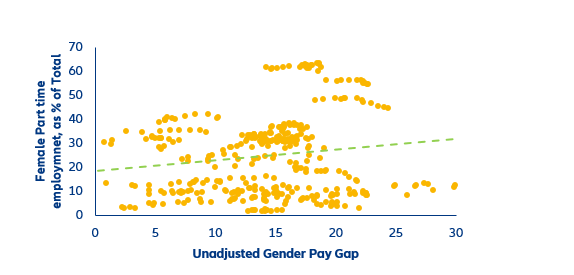
  • In the EU, women get paid 13% less than men in terms of average gross hourly earnings. Although this is smaller than the global gender pay gap (20% according to the ILO), it does not necessarily reflect more gender equality; for some countries, it merely depicts lower participation rates in paid employment.
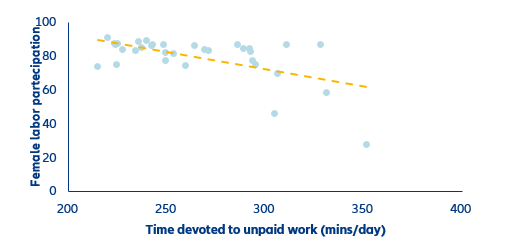
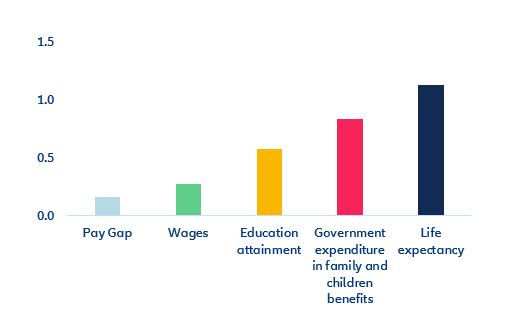
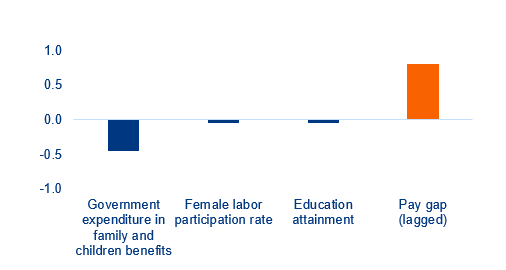
  • Increasing female labor participation rates in developed economies makes economic sense. We estimate that life expectancy, tertiary education attainment and government expenditure in policies that support families and children have the strongest effect on female labor supply. However, the effects of labor costs (wages) and the unadjusted pay gap are more muted.
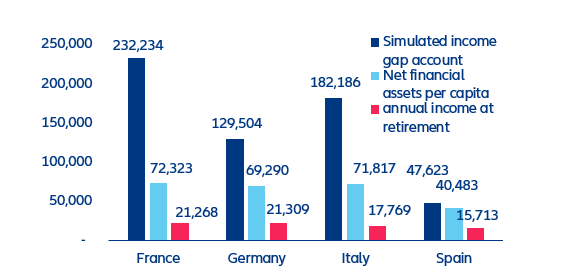
  • According to our calculations, if invested, the income gap between men and women could represent almost 11 times the annual female retirement income in France, 10 times the annual retirement income for women in Italy, 6 times that of women in Germany, and 3 times the annual female retirement income in Spain.

This week, the EU and the UK struck a deal to soften the ‘hard’ border in the Irish Sea, which facilitates trade between Northern Ireland and the rest of the UK.  Since Brexit, non-tariff barriers such as increased red tape at customs have substantially hampered trade flows. In order to preserve the free circulation of people and goods across Ireland and Northern Ireland (NI), the European Commission (EC) and the UK government under Prime Minister Johnson agreed to keep NI in the EU Single Market. This meant a ‘hard’ border in the Irish Sea between NI and the rest of the UK. However, the deal was never accepted by hard-line Brexiters or the DUP (the NI Unionists), and the Sunak government has explored ways to soften the border to appeal to its electoral base.

The Windsor Framework will reduce Brexit-related uncertainties – the failure to reach an agreement could have knocked off 2.5% of business investment and -0.3% of GDP in 2023-24. Under the deal, the UK will build border control ports at Northern Irish ports in order to simplify the processes needed for traders in Britain to send certain goods to NI. Products registered via a trusted trader scheme and labelled for ‘NI-only’ consumption will flow more freely from Britain to NI. However, the full list of the products concerned by softer trade rules has not yet been published. Overall, the Windsor Framework signals healthier relations between London and Brussels, while opposition to the deal from hard-line Brexiters and DUP members has so far been relatively muted. Consequently, future spats between the UK and the EU are less likely, and, more importantly, the risk of the EU removing its free-trade agreement with the UK –a remote possibility under previous UK cabinets – is now extremely low.

Figure 1: UK business investment and overall uncertainty index

Figure 1: UK business investment and overall uncertainty index
Sources: Refinitiv Datastream, Allianz Research.

However, the Windsor Framework is not a game changer from an economic perspective. NI makes up only around 2% of the UK economy. Trade flows between the EU and the UK will remain less than what they could have been had the UK remained in the EU. However, the failure to reach an agreement could have increased Brexit uncertainty and weighed on business investment, given the strong lead effect of uncertainty on capital spending (Figure 1).  To illustrate this, we investigate the impact of renewed Brexit-related uncertainty on business investment using a simple statistical framework. We assume that the failure to strike a deal would have led to an increase in overall uncertainty through 2023 of around a quarter of that observed in 2016 (during the Brexit referendum, Figure 2). Under this scenario, we find that the level of business investment would have been -2.5% lower until 2024, reducing GDP by -0.3% (without accounting for negative spillover effects). Our calculations show that the pullback in overall uncertainty in 2022 supported business investment by more than +1% (+0.1% GDP). Conversely, the Brexit-induced sharp rise in uncertainty in 2016 knocked business investment down by -4.5%.

Figure 2: UK overall & economic policy uncertainty indices

Figure 2: UK overall & economic policy uncertainty indices
Sources: Refinitiv Datastream, Allianz Research.

The record contraction of US money supply spells doom for financing conditions over the near term. After reaching an all-time high-water mark in March 2022, US money supply (M2) declined by 472 billion (or -2.2%), which was driven entirely by a shrinking deposit base (-USD720 billion).  Over the same period, M1 decreased even more (-5.1%). In the post-WWII history, this is a unique event. It explains most of the recent slowdown in the growth of global money supply (from +8% y/y in March 2022 to 5.8% in January 2023). So far, the contraction in the money supply has not been the result of a contraction in bank lending. However, this is most likely the next step in the current tightening cycle.

We can derive the impact of the change in money supply on bank lending by comparing the changes in assets and liabilities of commercial banks with the change in assets and liabilities of the US Federal Reserve (Figure 3). More specifically, we subtract the non-monetary liabilities of commercial banks from the US Federal Reserve’s assets after controlling for changes in base money and the bank’s deposit base to derive monetary counterparts (which are not observable in published data). We find that bank loans have expanded by USD1.1trn, but securities holdings of commercial banks and the Federal Reserve have shrunk by USD758bn. Commercial banks typically sell bonds when they can make loans, so this development is expected. Cash holdings by commercial banks declined by USD470.7bn. Added together, these three factors explain almost two-thirds of the contraction in M2 (excluding retail money market funds).

Going forward, a significant decline in bank lending seems inevitable amid the collapse of monetary aggregates. From March 2022 to January 2023, bank lending has increased at an annualized rate of +11.6%, with some segments growing even faster: +14.4% for commercial and industrial loans, +12.1% for real estate loans, +16% for credit cards. In a context of tightening credit conditions, such high growth rates are unlikely to be sustainable. Already, since November 2022, annualized credit growth has declined to +8.4%. However, at an annualized rate of growth of +12.3% and +16.1%, credit card and real estate loans (especially commercial real estate) are still going strong.

Figure 3: Counterparts of US M2 (excluding money market funds)

Figure 3: Counterparts of US M2 (excluding money market funds)
Sources: Refinitiv Datastream, Allianz Research.
Semiconductor sales started declining in the second half of 2022, which depressed annual sales to ”only” +7.6% y/y after a record 2021 (+24.3%, Figure 4). Sales are expected to decline by around -5% this year. Over the last 30 days, the 580 billion dollar industry has fallen into recession every four years, lasting for about nine months. Despite its highs and lows, the industry has grown at a healthy +8% p.a. on average, driven by the global economy’s growing chip intensity (computers going mainstream in the 1990s, mobile phones in the 2000s, smartphones in the 2010s, cars & buildings in the 2020s) and the introduction of ever more powerful and efficient chips. The key feature explaining its boom-and-bust nature is supply inertia – it takes months for the industry to cut production and years to add new capacities, resulting in dramatic moves in prices when demand booms or stalls.

Figure 4: Global semiconductor sales
Sources: WSTS, Allianz Research

Chips for computers and smartphones have gone from scarce to abundant in a few months. The current recession has been no exception to the industry’s pattern: after two years marked by strong demand from key final markets, demand from the same markets is going into negative territory and sending prices down. The spread between semiconductor sales growth (value) and silicon wafer shipments growth (volume), a proxy for semiconductor prices, has been negative since Q3 2022 (Figure 5) due to falling sales of electronic devices and a gloomy outlook for 2023.

Figure 5: Silicon wafer shipments and semiconductor sales (y/y change in %)

Figure 5: Silicon wafer shipments and semiconductor sales (y/y change in %)
Sources: SEMI, WSTS, Allianz Research
In particular, the slowdown of semiconductor sales since last year is expected to continue in the three final markets, which together account for 80% of sales (consumer electronics (-6%), computing (-12%) and telecom industries (-3%)) (Figure 6). Demand for semiconductors will only pick up when the industry, all the way from retailers to consumer electronics companies through to semiconductor-design and semiconductor-manufacturing companies, is done clearing inventories of finished goods and components.

Figure 6: Semiconductor sales by segment (% change)
Sources: IDC, Allianz Research

The Chinese consumer may support a faster recovery in semiconductor sales. The world’s factory for electronic devices, China is also home to the largest and second-largest consumer markets for smartphones and computers, with a share of 18% and 23% of global shipments, respectively. Both segments could benefit from the reopening of China’s economy and the trillions in excess savings Chinese consumers have been accumulating in past quarters. This would help mitigate falling sales in Europe and North America, where inflation has considerably dented the purchasing power of households. The industry’s dominant assumption so far is that Chinese demand will outpace the global trend, but not enough to report higher shipment volumes for 2023. However, any significant positive surprise on the consumer side could accelerate the recovery in semiconductor demand.

Taiwan, South Korea, and Singapore will feel the pinch of the semiconductor recession in 2023. Home to 75% of global semiconductor manufacturing capacities and 90% of semiconductor exports, Asia-Pacific is experiencing the strongest headwinds from the current recession, which is already appearing in macroeconomic data releases. Plotting the trade balance in semiconductors against the share of semiconductors in exports of Asia’s top chip exporters, we find that Taiwan, South Korea, Singapore, Malaysia, the Philippines, and Japan are the most at risk (Figure 7). Because of its comparatively greater reliance on memory semiconductors, global sales of which are forecast to decline by as much as -20% this year, South Korea will be hit the hardest by the recession. Local semiconductor exports declined by -45% year-on-year in January 2023.

Figure 7: 2021 semiconductor trade balance (billion USD, vertical scale) and share of semiconductor in country exports (%, horizontal scale)

Figure 7: 2021 semiconductor trade balance (bn USD, vertical scale) and share of semiconductor in country exports (%, horizontal scale)
Sources: Intracen, Allianz Research

A lower electronics bill for China and global consumer. Lower semiconductor prices and greater chip availability are good news for China: The country’s semiconductor import bill stood at a whopping USD433bn in 2021, dwarfing even its thirst for crude oil (258 billion dollars). Chips were responsible for a trade deficit of USD278bn. Lower component prices will somewhat lower the burden of electronics manufacturers exporting over 460 billion dollars in computers and smartphones, and in turn be felt globally by corporates and consumers looking to replace or upgrade their IT equipment.

…and a relief for European and American automotive supply chains. Because they are comparatively less profitable to manufacture, automotive and industrial chips are traditionally assigned a lower priority by semiconductor foundries. Now that demand for computer and telecom chips from Asian customers is gone, a fraction of idle manufacturing capacities is being reallocated to European and North American industrial customers. Reflecting this progressive easing in supply chain tensions, car registrations in North America and Europe have been picking up continuously since August 2022. Sales of industrial and automobile semiconductors are expected to buck the wider trend and grow by a low single digit in 2023.

At the same time, Europe and North America have learned their lesson from the shortages: Both regions are seeing rising manufacturing investment as they seek greater autonomy in semiconductor manufacturing. Their reliance on Asian contract manufacturers was laid bare by the magnitude of the semiconductor shortages that crippled their industries in 2021 and 2022. Together with a geopolitical drive to counter China’s growing ambitions in the industry, shortages have prompted policymakers on both sides of the Atlantic to revamp incentives aimed at stimulating domestic manufacturing. Sales of semiconductor manufacturing equipment, a proxy for investment in manufacturing capacities, stood at an all-time high in Europe in 2022 and returned to levels last seen in 2014 in North America. While their share in global manufacturing equipment sales remain modest at 6% and 10%, respectively, both regions have built momentum, with significant investments announced by major semiconductor manufacturers. Should the trend consolidate, their economies would be less exposed to future periods of tight semiconductor supply arising from the highs and lows of the Asian consumer electronics manufacturing ecosystem.

According to the International Labor Organization (ILO), women are paid about 20% less than men on average due to structural gaps preventing equal opportunity. Every year on International Women’s Day (March 8th), we celebrate how far we have come as a society in strengthening women’s rights, but we are also reminded of the road ahead in achieving gender equality. The gender pay gap is a case in point, even in advanced economies in the Eurozone.  

Figure 8: Unadjusted gender pay gap in the EU

Figure 8: Unadjusted gender pay gap in the EU
Sources: Eurostat, Allianz Research.

In the EU, the difference between average gross hourly earnings of men and women as a percentage of male earnings is 13%. This is how Eurostat defines the unadjusted gender pay gap. While it might seem like this is well below the global average, this figure hides the differences between and within countries in the EU (Figure 7), which could be explained by education, type of employment, skills, and experience. Moreover, lower pay gaps do not necessarily reflect more gender equality; for some EU countries, they merely depict lower participation rates in paid employment.

Wider gender pay gaps are said to reflect women’s choice to engage in part-time employment. This might be one of the factors that contributes to the difference in earnings, but it hardly paints the full picture. When comparing this argument to the data, we see a very weak correlation between part-time employment and the unadjusted gender pay gap across our EU sample: not the answer we were looking for.

Figure 9: Female part-time employment as a % of total female employment and the unadjusted gender pay gap

Figure 9: Female part-time employment as a % of total female employment and the unadjusted gender pay gap
Sources: Eurostat, Allianz Research
Women are less likely to work full-time due to structural factors, for instance to accommodate care activities. Most neoclassical macroeconomic models suggest that the labor supply is a function of the utility of consumption and leisure. However, for women, it would be more accurate to include the rising opportunity costs of working outside the home if there is no designated homemaker. This is hardly a new notion. To dig deeper on gender inequalities in and outside the workplace, the OECD publishes statistics on how both men and women allocate time to domestic and family responsibilities, and time spent on paid work. Unsurprisingly, women in developing countries such as South Africa (71% of total time devoted to unpaid work in the household), Mexico and China (72%), Turkey (82%), and India (87%) carry the lion’s share of unpaid work. However, in developed economies, such as Italy (70%), Greece (73%), Portugal (77%), South Korea (81%) and Japan (85%), the phenomenon is also pervasive. Culture, as much as economic development, plays a role in the distribution of domestic activities (Figure 9).

Figure 10: Inequalities in unpaid work, create inequalities in paid work
 Figure 10: Inequalities in unpaid work, create inequalities in paid work
Sources: OECD, OWID, Allianz Research

It is worth noting that over the last few years, men have been gradually increasing the amount of time they devote to unpaid work (Figure 10). However, multiple studies point to the fact that male participation in the unpaid labor force, at the population level, is remarkably sticky. Moreover, it is not the routine tasks that they engage in, but the more amenable ones such as childcare.  Research about the tautological “working women” highlights that the differences in female and male outcomes lie in education, labor markets, earnings, fertility, and life expectancy.

Therefore, to model employment decisions for women (female labor participation rate or FLPR) using macroeconomic data from Eurostat for 29 countries from 2010 to 2021, we look at the unadjusted gender pay gap, lagged tertiary education attainment, family and children-related government expenditure, female life expectancy as a measure of health and labor costs.  We estimate that life expectancy, tertiary education attainment and government expenditure in policies that support families and children have the strongest effect on female labor supply, while the effect of labor costs (wages) and the unadjusted pay gap have a more muted effect.

Increasing female labor participation rates in developed economies is relevant for a plethora of economic reasons, not only because adding more workers into the labor force could help improve declining productivity growth and the challenge of aging populations, but also because it could be an avenue to close output gaps (Figure 11). Research suggests that in the EU, women in leadership positions supports companies’ financial results.  

Figure 11: Female labor participation rate sensitivities (in pp)

Figure 11: Female labor participation rate sensitivities (in pp)
Sources: Eurostat, Allianz Research

Although the gender pay gap does not fully determine female labor supply choices, it is useful to know what could work when voting for and/or designing policies to break glass walls and ceilings for women. We find that government expenditure in family and children’s benefits, female labor participation and tertiary education attainment could decrease the gender pay gap. According to this approach, supporting the integration of women in labor markets appears to be the most impactful way of bridging the pay gap between men and women (Figure 12).

Policies could focus on areas that directly improve women’s professional attainment permanently, such as promoting the return of women to the labor force after career breaks, increasing the spending for care facilities, campaigning for young girls to focus on STEM (Science, Technology, Engineering, and Mathematics) careers and increasing the representation of women in political and economic decision-making positions.

Figure 12: Gender pay gap sensitivities (pp)

Figure 12: Gender pay gap sensitivities (pp)
Sources: Eurostat, Allianz Research

More broadly, gender pay gaps form part of a wide range of challenges, including a higher propensity of working part-time, career breaks for care responsibilities and/or maternity and higher life expectancy, affecting women’s retirement conditions. Unmarried women, whose number is on the rise in many countries, may face an increased likelihood of old-age poverty. On top of this, fiscal incentives for pensions also benefit men more than women, as they are more likely to have accumulated more funds in their retirement pots. Against this backdrop, we look at the income gap in the EU by age and country. The income that Eurostat publishes includes all income from work, investments and property, transfers between households and social transfers including old-age pensions. We look at the data of median income by age and by gender and simulate a savings account with this income gap between men and women yielding 5% net per annum. We estimate that this income gap represents almost 11 times the annual female retirement income in France, 10 times the annual retirement income for women in Italy, 6 times that of women in Germany, and 3 times the annual retirement income in Spain (Figure 13).

Figure 13: The income gap between men and women, in EUR per capita

Figure 13: The income gap between men and women, in EUR per capita
Sources: Eurostat, Allianz Research