Euler Hermes Global Trade Report 2021

Global Trade Report – Battling out of supply-chain disruptions

09 December 2021

Executive Summary

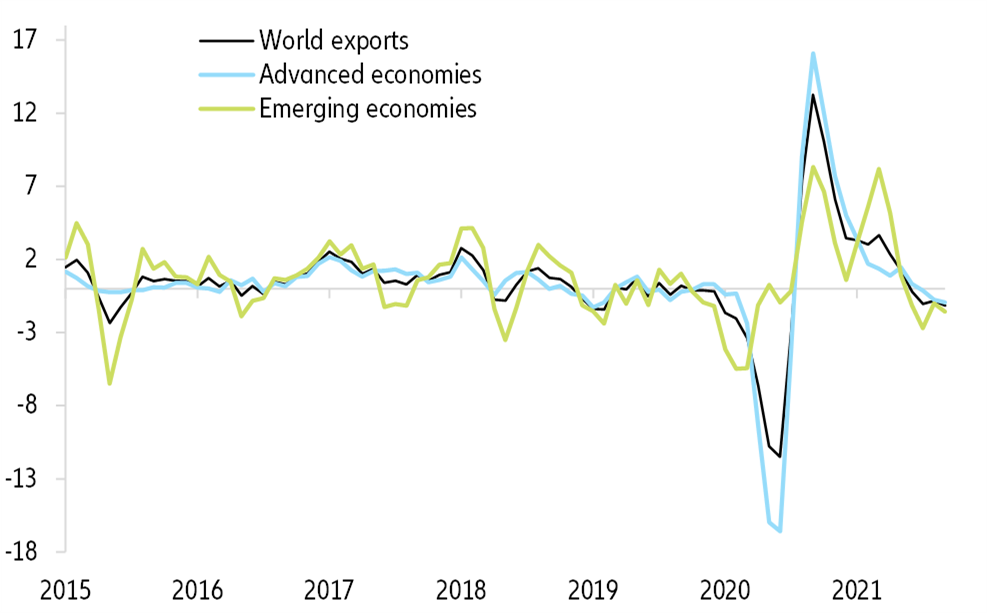
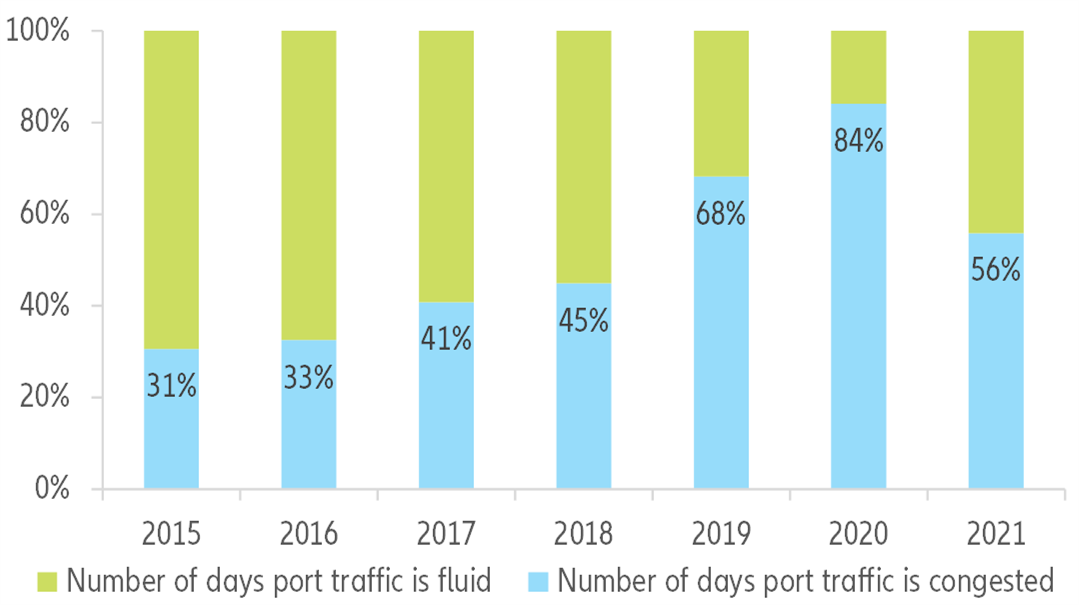
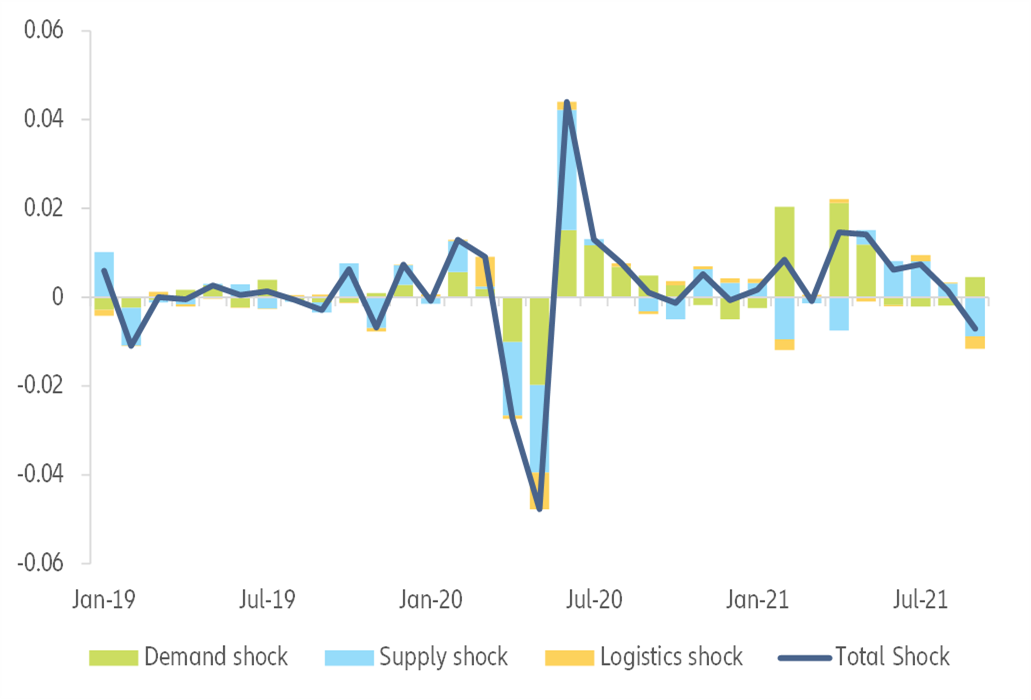
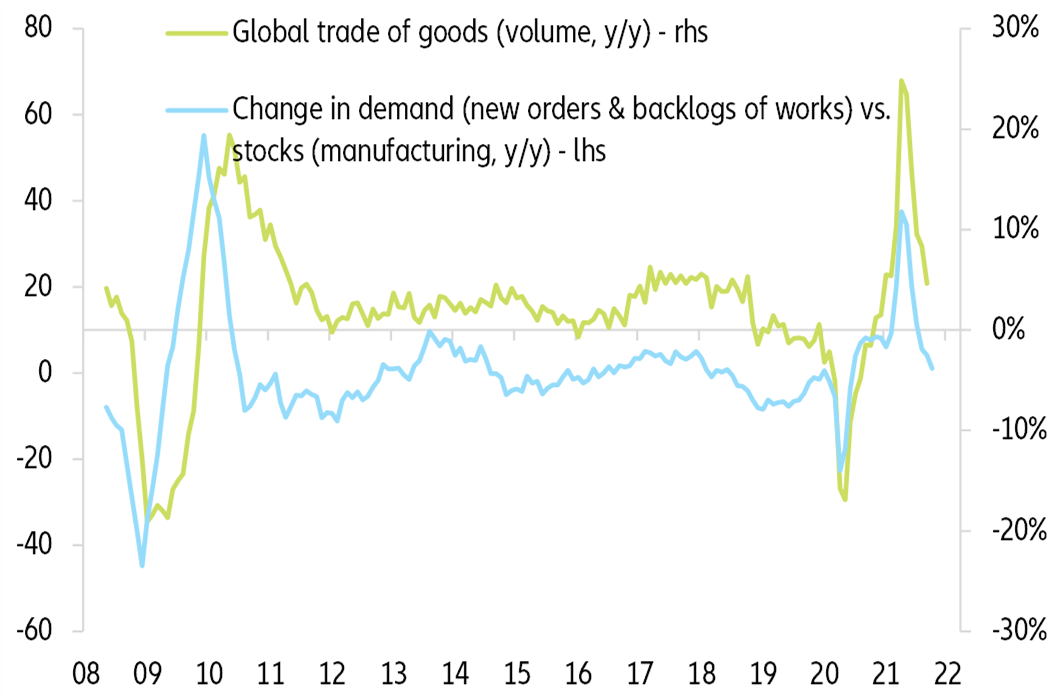
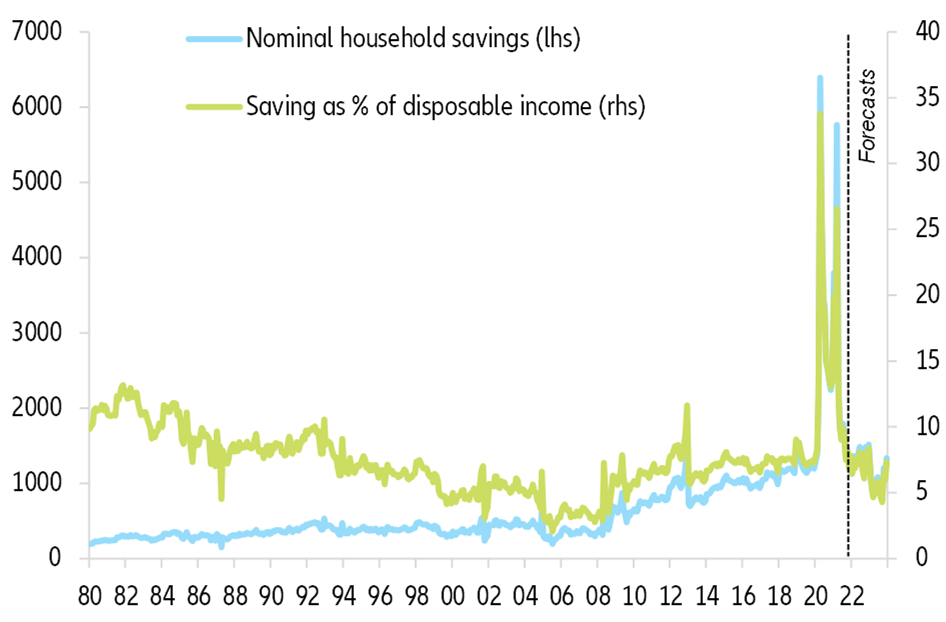
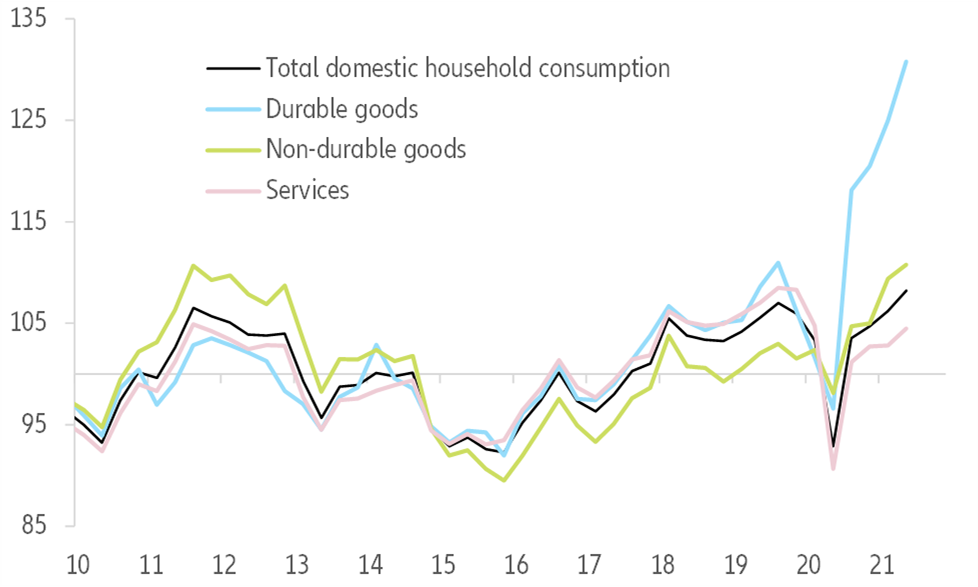
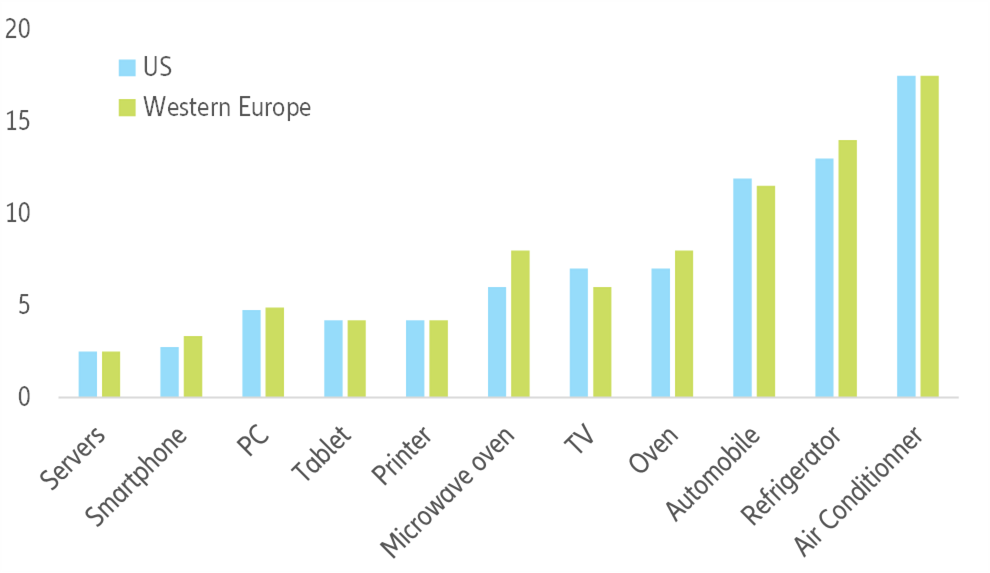
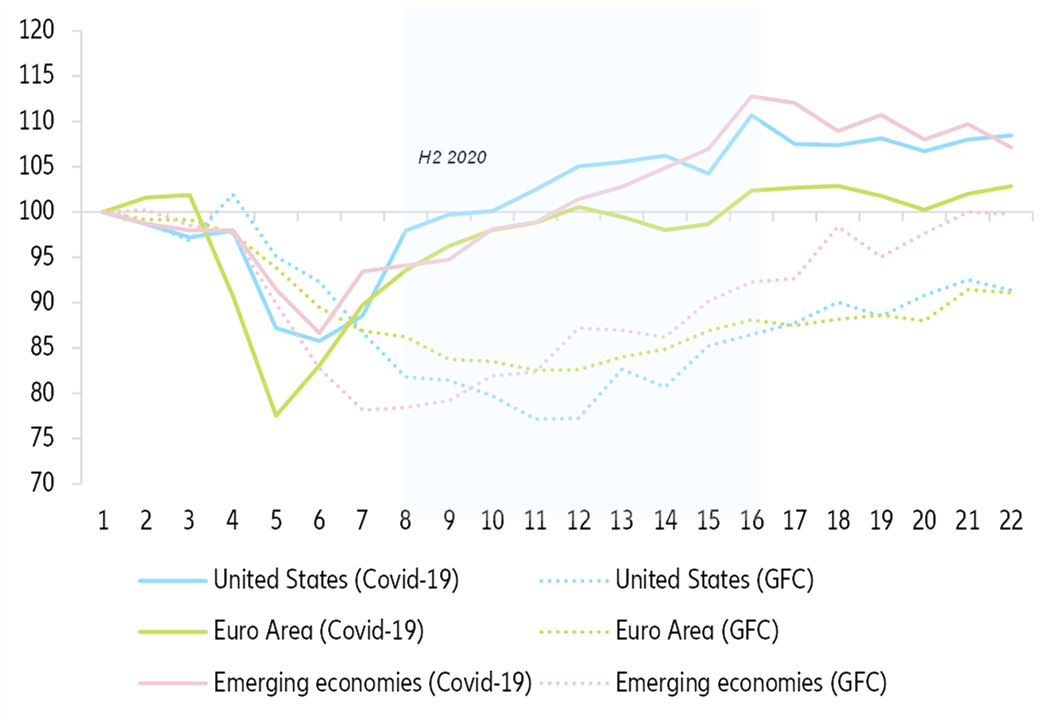
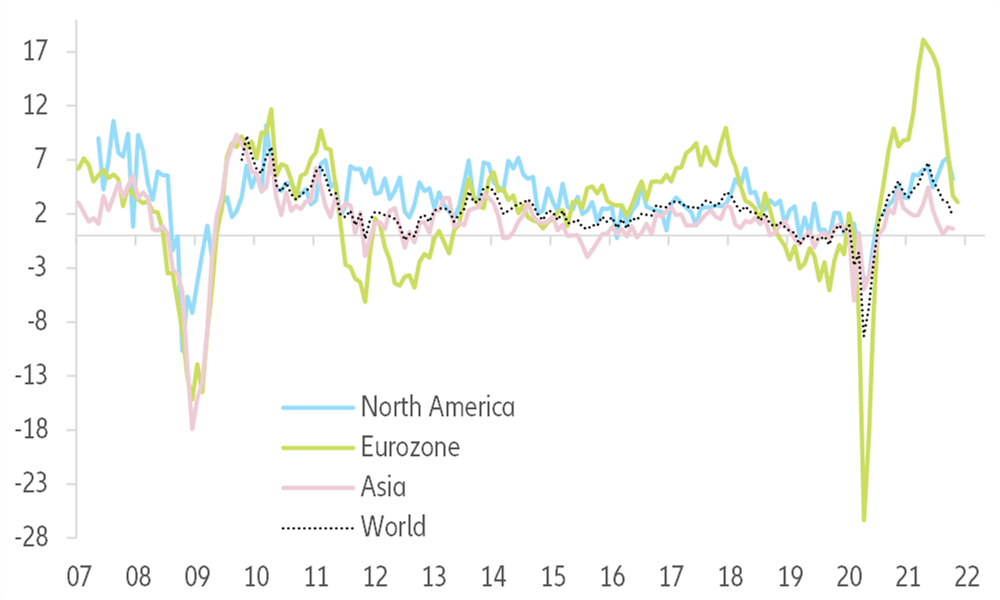
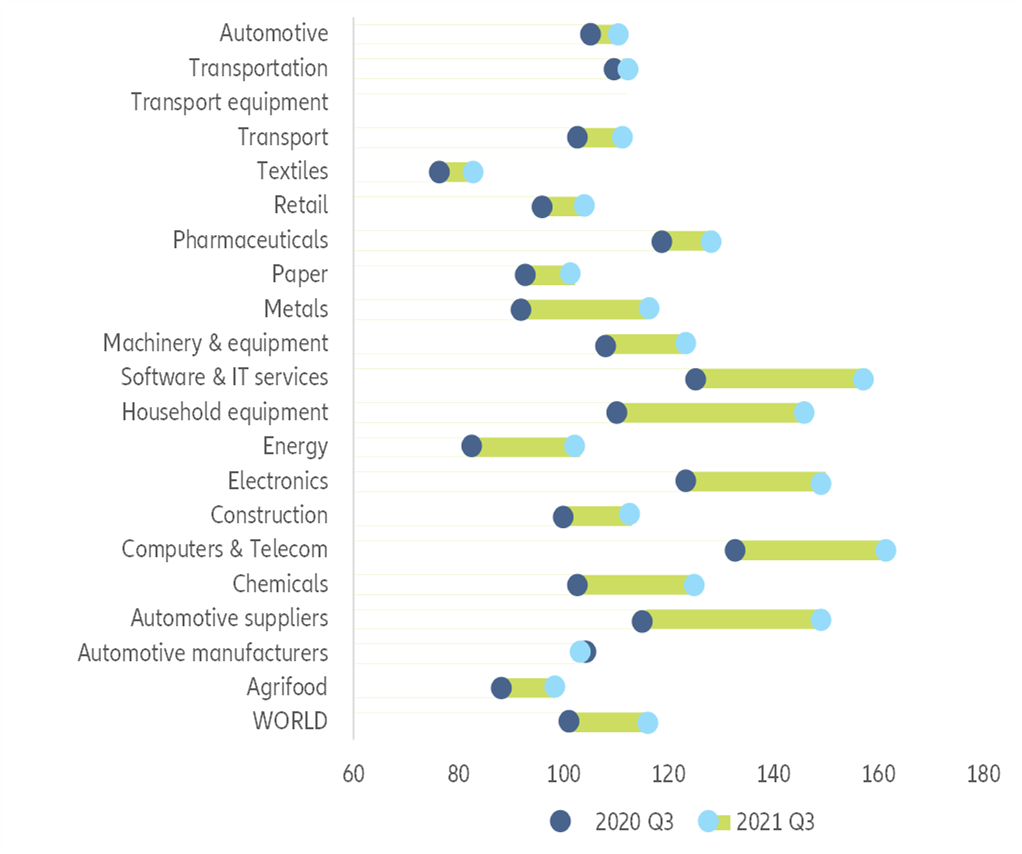
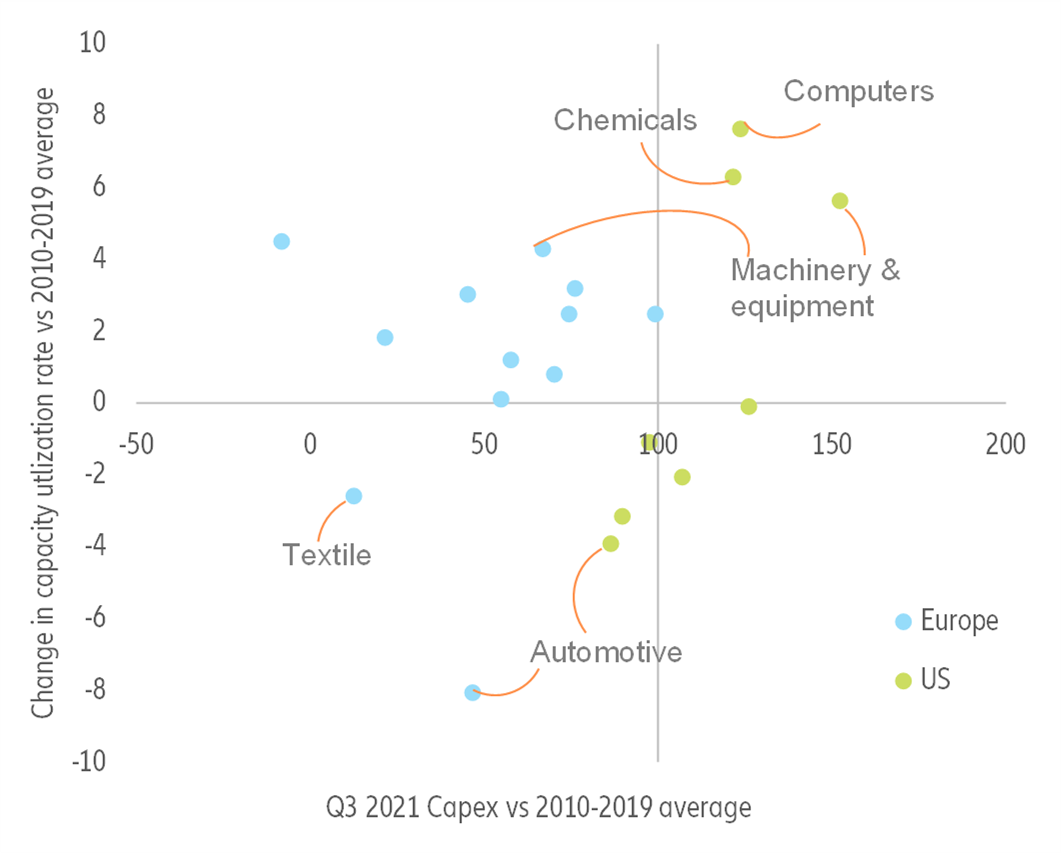
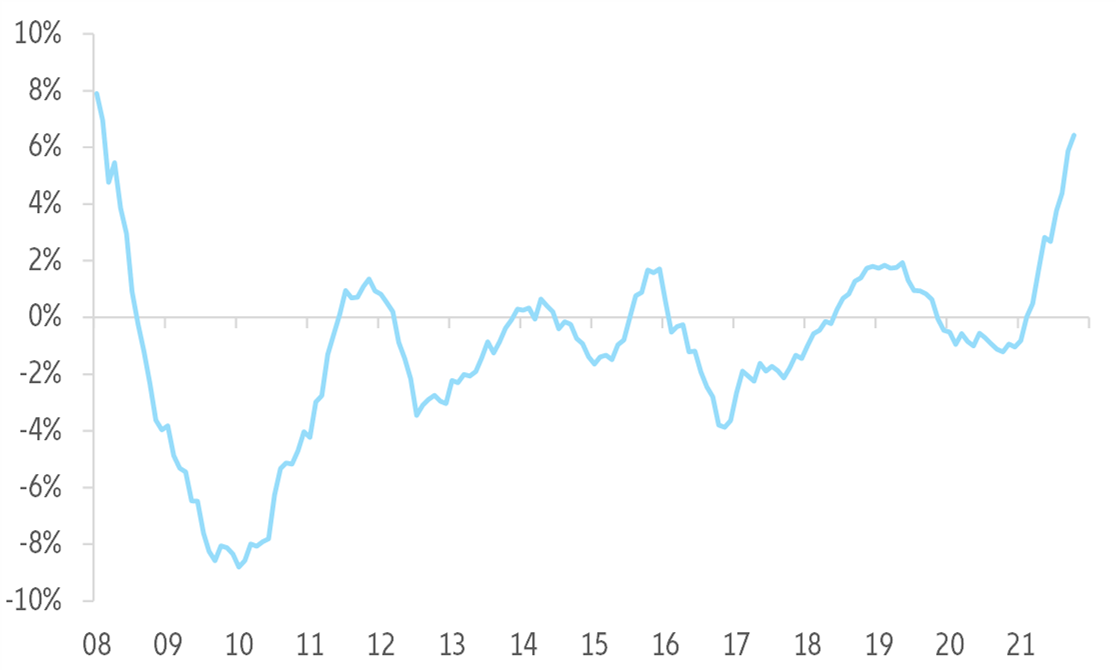
  • Global supply-chain disruptions will remain high until H2 2022, on the back of renewed Covid-19 outbreaks globally, China’s continued zero-Covid policy and demand and logistic volatility during Chinese New Year. After exceptionally strong performance since H2 2020, global trade of goods contracted in Q3. We find that production shortfalls are behind 75% of the current contraction in the global volume of trade, with the rest explained by logistic bottlenecks. In this context, a soft recovery in Q4 2021 is likely (+0.8% q/q after -1.1% in Q3 for trade in goods) but there is a risk of a double-dip in Q1 2022 as volatility in trade flows should remain the norm until the spring. Looking ahead, three factors will drive the normalization of trade from H2 2022: 1) A cooling down of consumer spending on durable goods, given their longer replacement cycles and the shift towards sustainable consumption behaviors. 2) Less acute input shortages as inventories have returned to or even exceeded pre-crisis levels in most sectors and capex has increased (mainly in the US). 3) Reduced shipping congestions as capacity increases.
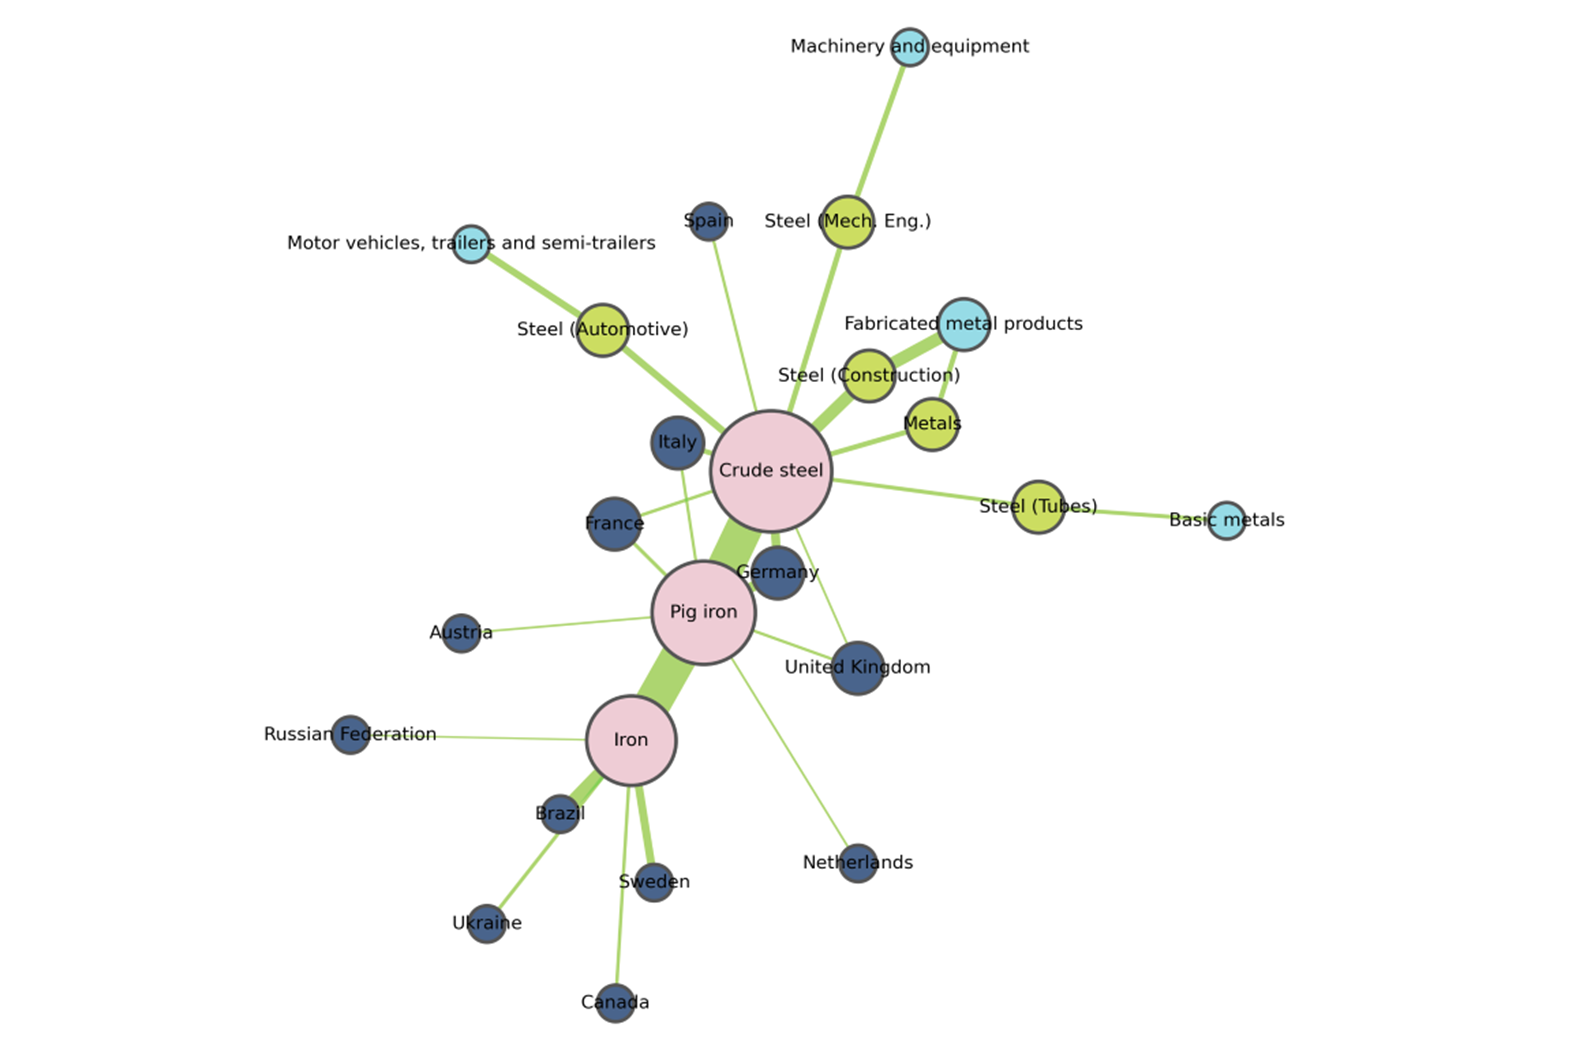
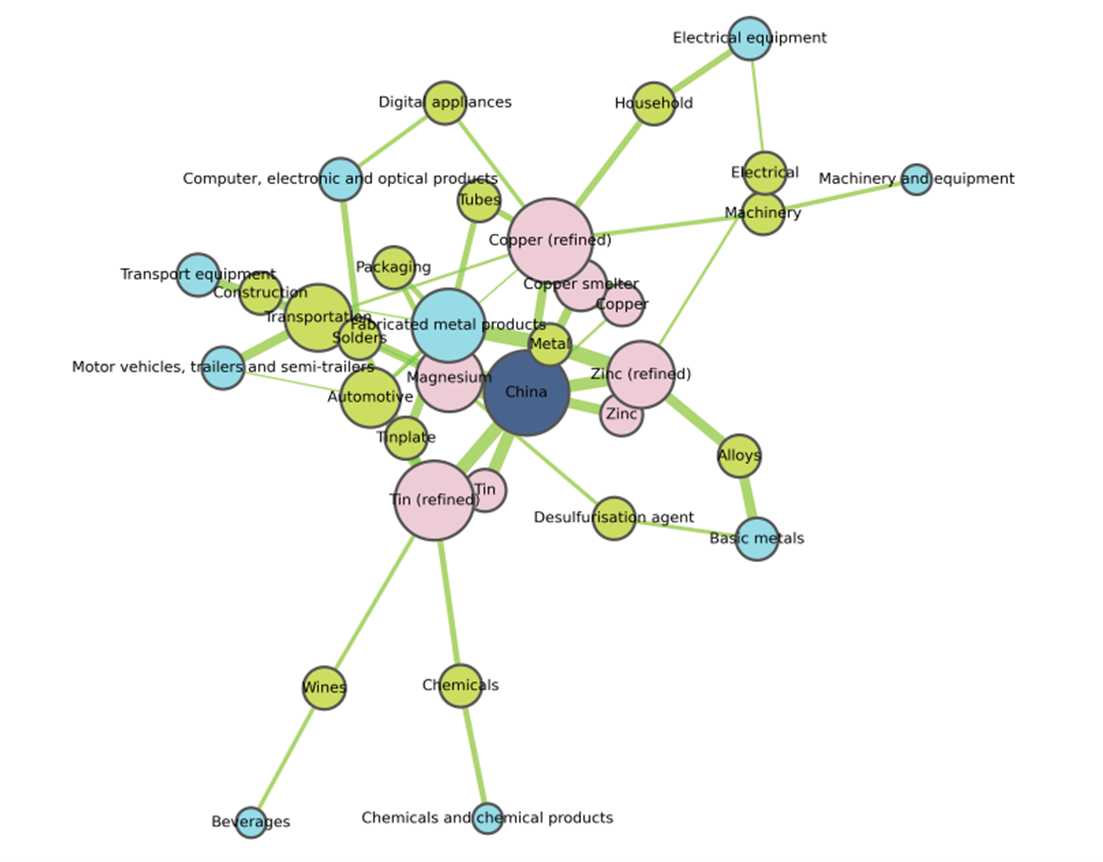
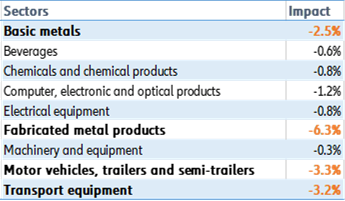
  • When it comes to inputs from China, Europe is on the weak side of the tug-of-war against the US. Europe is more at risk compared to the US when it comes to the heavy reliance on intermediate inputs from abroad, due to a lack of capex in production and shipping capacities. We simulate the impact of a shock represented by the Chinese slowdown (i.e. a 10% drop in Chinese exports) on EU sector outputs and find that the sectors that would be hit the hardest are the ones related to metals (basic metals and fabricated metal products) and automotive (motor vehicles, trailers and semi-trailers, transport equipment). Without production capacity increases and investments in port infrastructure, the normalization of supply bottlenecks in Europe could be delayed beyond 2022 as demand remains above potential.
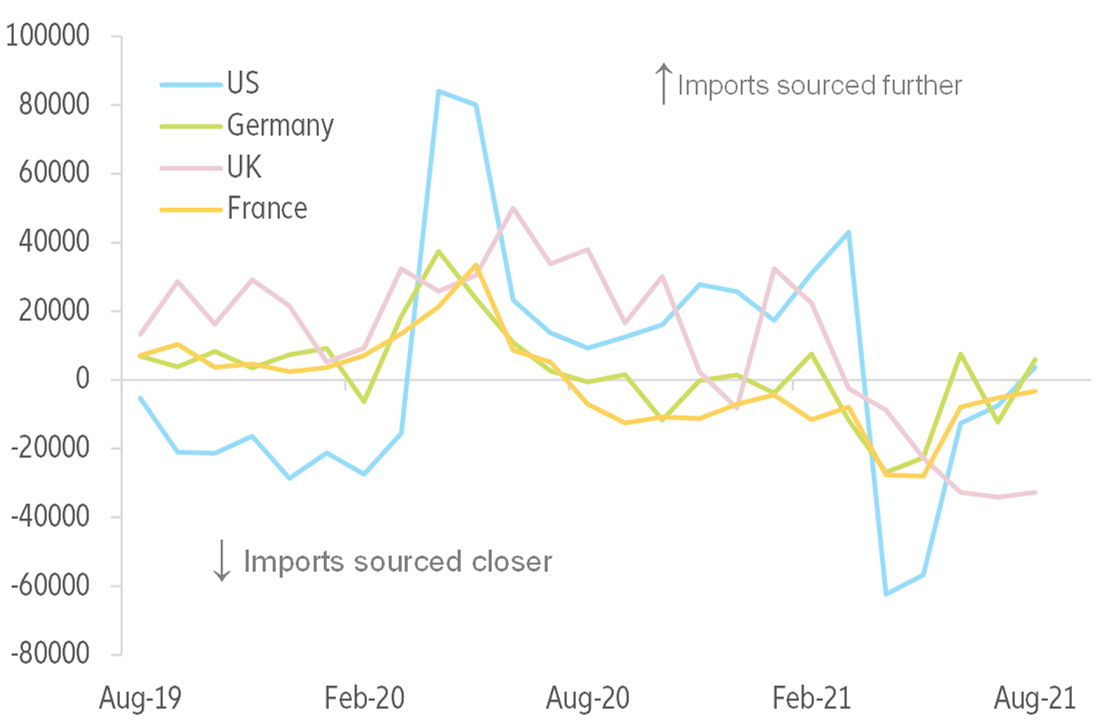
  • Yet, reshoring and nearshoring will remain more talk than walk. Despite supply-chain disruptions, we find no clear trend of reshoring or nearshoring of industrial activities so far. The only exception is the UK, which is likely to have faced disruptions due to Brexit. However, protectionism reached a record high in 2021 and should remain elevated, mainly in the form of non-tariff trade barriers (e.g. subsidies, industrial policies).
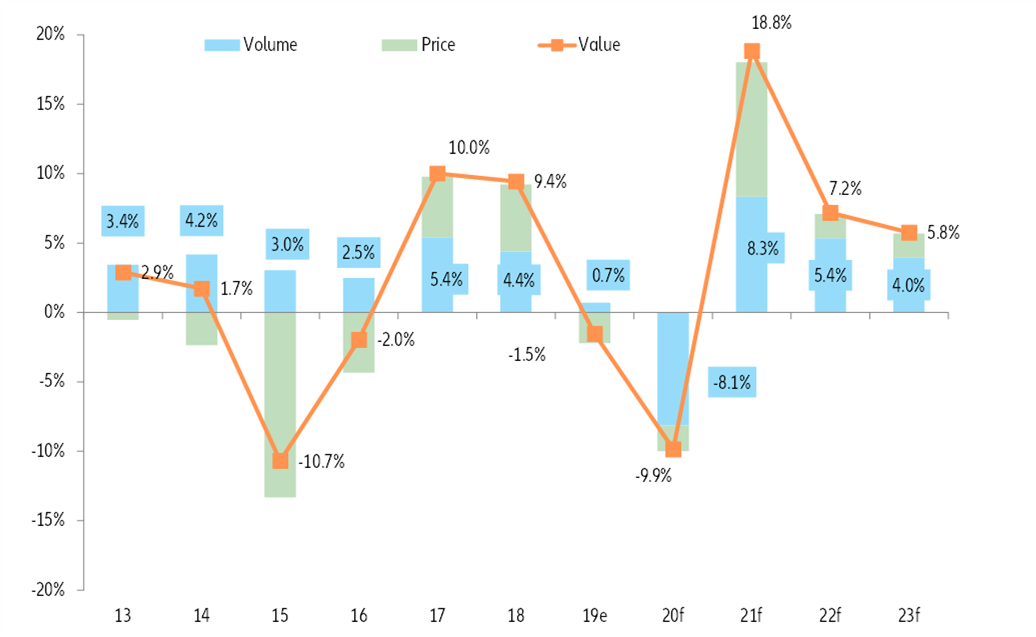
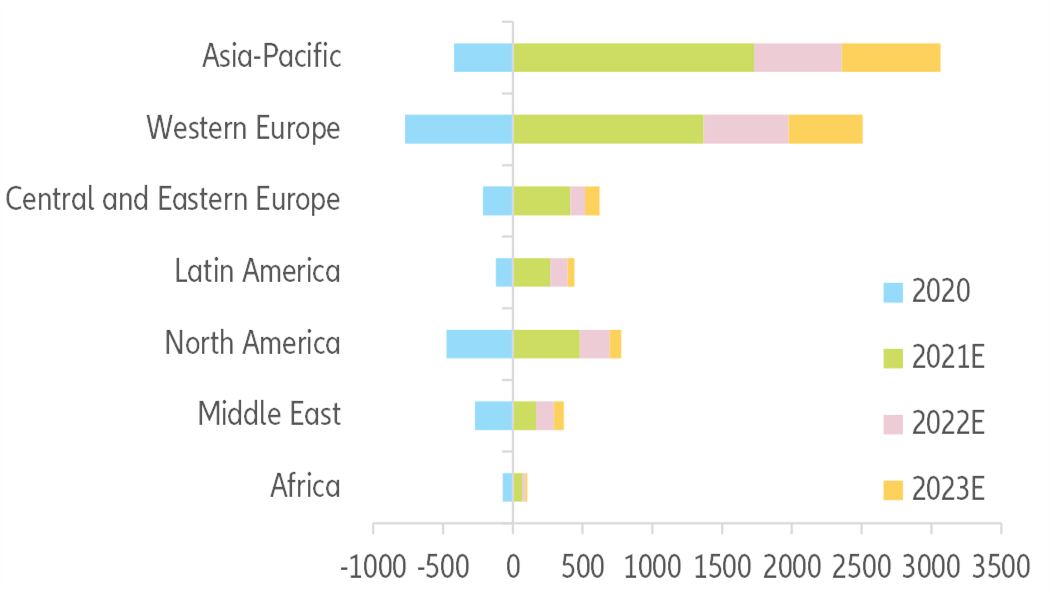
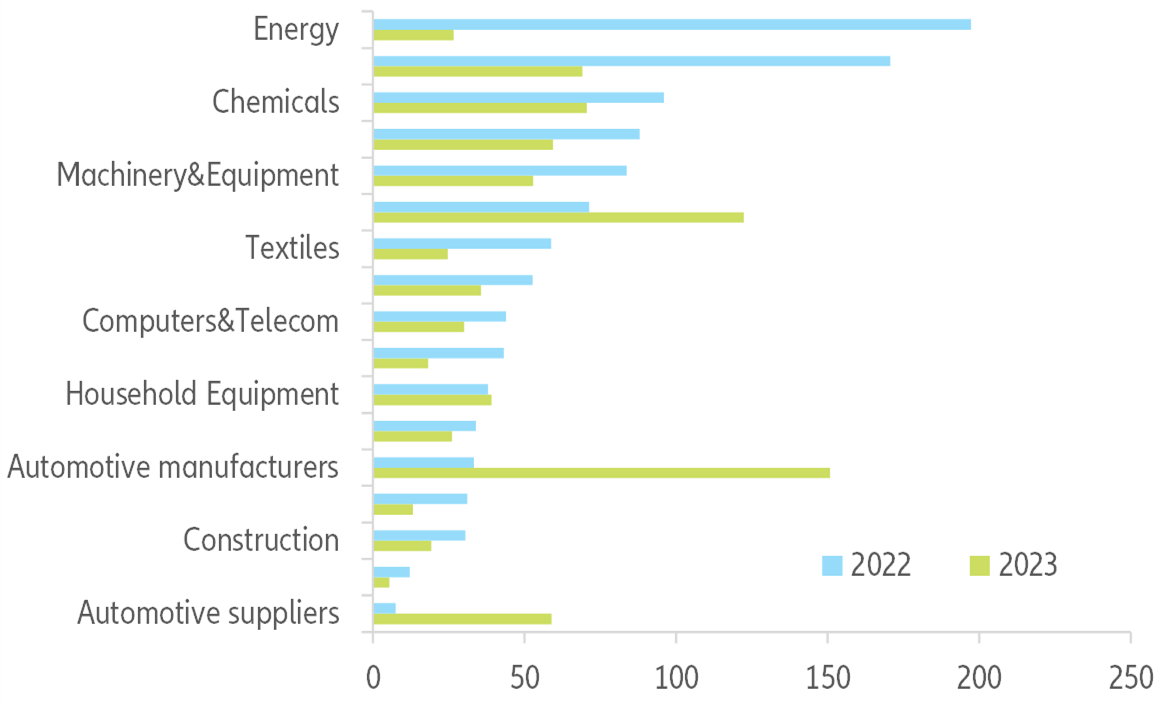
  • Overall, we expect global trade in volume to grow by +5.4% in 2022 and +4.0% in 2023, after +8.3% in 2021. But watch out for increased global imbalances: The US will register record-high trade deficits (around USD1.3trn in 2022-2023), mirrored by a record-high trade surplus in China (USD760bn on average). Meanwhile the Eurozone will also see a higher-than-average surplus of around USD330bn. In terms of export gains, Asia-Pacific should continue to be the main winner in the next few years (over USD3trn in 2021-2023). By sector, energy, electronics and machinery & equipment should continue to outperform in 2022, but the main export winner globally in 2023 should be automotive, thanks to the backlog of work and lower capex in 2021.
Production shortfalls are behind 75% of the current contraction in global volume of trade, while logistic bottlenecks explain the rest. After exceptionally strong performance since H2 2020, global trade of goods began to contract in July (-1.1% q/q in Q3 2021), especially in advanced and emerging economies (see Figure 1). While emerging markets remain mainly affected by the current Chinese economic slowdown, advanced economies are suffering more from supply bottlenecks rather than trouble with demand.

Figure 1 – Exports in goods in volume, %3m/3m
Sources: CPB, Euler Hermes, Allianz Research
Our China port congestion index (see Figure 2), built based on high-frequency port calls data, shows clearly that the number of days with congested traffic over 2020-2021 was much higher than the pre-pandemic average  on the back of unforeseen events (weather-related, the energy crunch and the closure of industrial factories, as well as the zero-Covid strategy).

Figure 2 – China port congestion index
Sources: UNCTAD AIS database, Euler Hermes, Allianz Research
In order to quantify the impact of each factor affecting global trade, we estimate it as a function of global demand (using US retail sales as a proxy), global supply (i.e. industrial production) and logistic conditions (i.e. suppliers’ delivery times from PMI surveys) using a VAR model. Looking at historical variance decompositions, which attribute the deviations from the baseline forecast of our model to each factor, we observe that demand shocks have been mostly contributing positively to global trade growth since July 2020. On the other hand, supply had a massive positive impact in summer 2020 but since then supply shocks have been quite volatile, most likely reflecting Covid-19-related hiccups. Furthermore, we notice that recent logistic shocks have been contributing more than in previous periods. In particular, we find that the latest “unexpected” drop in global trade is mainly due to supply and logistic factors. Both had a cumulative negative effect of -1.2pp on month-on-month global trade growth in September, with -0.3pp for the logistic factor and -0.9pp for supply (see Figure 3).

Figure 3 – Historical variance decomposition on global trade growth
Sources: Euler Hermes, Allianz Research
However, the contraction should be temporary, even as renewed global Covid-19 outbreaks, China’s sustained zero-Covid policy and Chinese New Year in February 2022 keep supply bottlenecks high. Looking at the short-term outlook, a soft recovery in Q4 2021 is likely (+0.8% q/q), as suggested by country-level data that are considered bellwethers and considering that trade volume is c.4% below its trend due to supply issues and port congestion over the past few months. Exports from China and Japan showed a sequential improvement in October, and preliminary November data for South Korea exports suggest that recent headwinds might be easing. However, the dynamics of global demand hint towards a risk of a double-dip in global trade in Q1 2022 (see Figure 4) amid the Chinese economic slowdown and renewed Covid-19 infections in Europe and the US.

Figure 4 – Global trade of goods in volume (%y/y) and proxy for demand-inventories mismatch
Sources: CPB, IHS Markit, Euler Hermes, Allianz Research
The ongoing supply-chain disruption is the legacy of mismatches in global demand and supply and shipping capacity that began with the Covid-19 outbreak. However, these disruptions have peaked and we expect them to ease going forward.

Factor #1: Consumer demand peaked at unprecedentedly high levels and is likely to remain above trend, as excess savings created during the crisis are not likely to be depleted by 2023. The replacement cycle of durable goods shows that the peak of supply-chain bottlenecks should have passed.
The demand side of global trade has been well above potential and should remain at a high level in the coming year, gradually going through a self-regulated normalization. This is explained first by the fiscal stimuli in reaction to Covid-19, which supported demand rather than supply, especially in the advanced economies where governments have deployed fiscal and monetary support equivalent to about 25% of GDP. While this support is gradually being phased out, fiscal policies will remain very accommodative in the US, Eurozone and China. In addition, households’ excess savings will continue to support consumer demand well into 2022 and 2023. In the US, we expect the saving rate to reach its pre-crisis level (7.3% of disposable income) towards the end of 2022, as the recovery in labor markets will support household purchasing power (see Figure 5). In Europe, excess savings are likely to support private consumption by 0.9% of GDP in 2022 and 0.5% in 2023 after 1.4% in 2021 (see Figure 6).   

Figure 5 – US household savings (USDbn and % of disposable income)
Sources: Refinitiv, Euler Hermes, Allianz Research
Figure 6 – Expected boost to private consumption from remaining excess savings (as of mid-2021, latest available data), % of GDP
Sources: Eurostat, ONS, Euler Hermes, Allianz Research
Second, the impressive household spending shift towards (durable) goods rather than services (see Figure 7), in the context of curfews and lockdowns, should be much more timid going forward, even in a downside scenario of renewed Covid-19 outbreaks. Indeed, the replacement cycle of durable goods is several years (see Figure 10) and households are moving towards more sustainable consumption patterns, especially in advanced economies. However, we do see risks tilted towards an earlier-than-expected tightening of the policy mix, which could make demand nosedive.

Figure 7 – Domestic household consumption in advanced economies (100 = average over 2010-2019)
Sources: OECD, Euler Hermes, Allianz Research
Figure 8 – Replacement cycle of selected goods (number of years)
Sources: Multiple sources, Euler Hermes, Allianz Research
Factor #2: Inventories have reached pre-crisis levels and output capacity will rise, thanks to increases in capex, mainly in the US. After destocking at the height of the Covid-19 crisis in early 2020, manufacturers had to quickly restock in order to cope with the unprecedented rebound in demand in advanced economies (+22% from trough to peak, and return to pre-crisis levels as soon as October 2020 (see Figure 9)). The input shortage was particularly high in Europe in 2021, and to a lower extent in North America. The good news is that the urgency to restock has clearly peaked over the past few months (see Figure 10) and the level of inventories is already above pre-crisis long-term averages among most sectors (see Figure 11). The electronics, computers & telecom and household equipment sectors in particular were able to significantly increase their inventories despite semiconductor shortages. The automotive sector also managed to add inventories, though less successfully due to higher difficulties in accessing semiconductors and higher costs of accumulating produced goods.

Figure 9 – Import in volume, 100 = pre-crisis peak during the Global Financial Crisis and the Covid-19 crisis
 Figure 9 – Import in volume, 100 = pre-crisis peak during the Global Financial Crisis and the Covid-19 crisis
Sources: CPB, Euler Hermes, Allianz Research
Figure 10 – Input stock urgency* in the manufacturing sector (positive = urgency to stock)
* Quantity of purchases – Stocks of purchases
Sources: IHS Markit, Euler Hermes, Allianz Research
Figure 11 – Global sector inventories (average 2010-2019 =100)
Sources: Refinitiv, Euler Hermes, Allianz Research
Unlike in Europe, additional supply could fix the current shortages sooner in the US, given the increases in capex in 2021. To understand where new production capacities stand in the US and Europe, we look at capex and capacity utilization rates (see Figure 12). Generally speaking, investment efforts are higher in the US than in Europe. Indeed, some sectors in the US (e.g. computers and machinery and equipment) are exhibiting higher capex than the pre-pandemic long-term averages despite high levels of capacity utilization. European companies seem comparatively less advanced in their investment cycle, with capex below normal levels, and they rather rely on above-normal capacity utilization rates to respond to higher demand. We see a potential for a catch-up in investment in Europe in 2022 (and later on in production capacity), given favorable funding conditions and elevated corporate cash positions. Most surveys show that a majority of companies have delayed investment decisions in 2021 due to supply-chain bottlenecks and input shortages.

Figure 12 – Capex vs capacity utilization rates in the US and Europe
Sources: OECD, Euler Hermes, Allianz Research
Factor #3: Shipping congestions should be less acute as capacity is increasing: global orders for new container ships have reached record highs over the past few months, amounting to 6.4% of the existing fleet, while the US will spend USD17bn on upgrading its port infrastructure. In the short-term, we expect shipping costs to gradually decline from Q4 2021, in line with the futures markets for shipping, after peaking in September 2021 at levels six to seven times higher than before the Covid-19 crisis. However, they will remain at elevated levels in 2022.

The rapidly growing new transportation capacity orders (see Figure 13) should turn operational towards the end of 2022, which should significantly ease shipping bottlenecks (we estimate that c.4% of the volume of global trade is currently blocked due to shipping constraints). Another factor that could help unclog shipping bottlenecks is port capacity. After all, adding ships without increasing the infrastructure to load and unload them would still lead to congestions. Industry data show that it now takes three times longer to clear vessels at Los Angeles and Long Beach, bringing the waiting time to 7-12 days. This compares with up to 6 days in Rotterdam, and 1-3 days at large Chinese ports.

Figure 13 – New orders of container ships (12-month rolling sum, as % of existing fleet)
Sources: World Bank, Euler Hermes, Allianz Research
The US is planning USD17bn of additional spending on port infrastructure and waterways  and USD25bn on airports to address repair and maintenance backlogs, reduce congestion and emissions and drive electrification and other low-carbon technologies. Indeed, over the past decade, both the US and Europe have lagged in terms of the quality of port infrastructure, which has constantly missed the “well developed and efficient by international standards” mark assigned by the World Bank (see Figure 14). Europe is still lacking large-scale infrastructure investment plans (see Figure 15), which will maintain its vulnerability to supply-chain shocks in the long term, given its dependency on inputs from abroad, especially Asia.

Figure 14 – Quality of port infrastructure, WEF (1=extremely underdeveloped to 7=well developed and efficient by international standards)
 Figure 14 – Quality of port infrastructure, WEF (1=extremely underdeveloped to 7=well developed and efficient by international standards)
Sources: World Bank, Euler Hermes, Allianz Research
Figure 15 – EU: Recovery and Resilience Fund grants (main investment categories, % of total)
Sources: European Commission, Euler Hermes, Allianz Research
Stimulating demand in Europe without fixing supply issues can only be inflationary. Europe is more at risk compared to the US when it comes to the heavy reliance on intermediate inputs from abroad. In the absence of production capacity increases and investments in port infrastructure, the normalization of bottlenecks in Europe could be delayed beyond 2022 if demand remains above potential (our baseline scenario). More precisely, the household equipment, consumer electronics, automotive and machinery and equipment sectors are most vulnerable to input shortages. Using the OECD 2018 Input-Output tables, we compute the Hirschman–Rasmussen Backward Linkages (BL) and Forward Linkages (FL) indices . In our sample including 23 sectors, 14 have a BL above one in the US, 16 in Germany, 17 in France and 12 in the UK. This means that a majority of sectors are heavily reliant on intermediate inputs. Only nine sectors in the US, eight in Germany, six in France and seven in the UK have a FL above one. Using these two metrics, we can group sectors into four segments: “key” sectors that have BL and FL above one, “weak” sectors that have BL and FL below one, forward-oriented sectors that have BL below one but FL above one and backward-oriented sectors that have BL above one and FL below one (see Figure 16).

Figure 16 – Hirschman-Rasmussen BL-FL indices
Stimulating demand in Europe without fixing supply issues can only be inflationary. Europe is more at risk compared to the US when it comes to the heavy reliance on intermediate inputs from abroad. In the absence of production capacity increases and investments in port infrastructure, the normalization of bottlenecks in Europe could be delayed beyond 2022 if demand remains above potential (our baseline scenario). More precisely, the household equipment, consumer electronics, automotive and machinery and equipment sectors are most vulnerable to input shortages. Using the OECD 2018 Input-Output tables, we compute the Hirschman–Rasmussen Backward Linkages (BL) and Forward Linkages (FL) indices . In our sample including 23 sectors, 14 have a BL above one in the US, 16 in Germany, 17 in France and 12 in the UK. This means that a majority of sectors are heavily reliant on intermediate inputs. Only nine sectors in the US, eight in Germany, six in France and seven in the UK have a FL above one. Using these two metrics, we can group sectors into four segments: “key” sectors that have BL and FL above one, “weak” sectors that have BL and FL below one, forward-oriented sectors that have BL below one but FL above one and backward-oriented sectors that have BL above one and FL below one (see Figure 16).   Figure 16 – Hirschman-Rasmussen BL-FL indices
Sources: OECD, Euler Hermes, Allianz Research
Interestingly a number of sectors are backward-oriented in France, Germany and the US: food and beverages, textiles, paper, machinery and equipment and automotive. In the UK, the automotive, paper, chemical products, mining and air transport sectors are backward-oriented.

Although many sectors are input intensive, and firms across all sectors in Europe and the US have reported higher-than-average supply constraints, only a few face very severe shortages: Machinery and equipment, automotive, consumer electronics and household equipment report tensions way above the average of the entire manufacturing sector. At the other end of the spectrum, sectors such as food, metals or paper are experiencing shortages lower than the manufacturing average.

As mentioned earlier, demand also plays a key role in the ongoing supply-chain tensions: In many industrial sectors, demand has been exceptionally strong since Q3 2020 as sectors were either making up for the lost time of H1 2020 or enjoying booming consumer spending on goods. Looking at our panel of European and US corporates, we find that 10 of the 17 sectors analyzed will emerge from 2021 with both sales and profits exceeding their pre-pandemic levels in Europe and those figures even climb up to 13 out of 17 for the US. However, we should note that the automotive sector, which has been severely hit by shortages, is still in recovery on both sides of the Atlantic. Consequently, the party could be spoiled for household equipment, machinery and equipment and consumer electronics, which are benefiting from the post-pandemic boom, while the recovery of the automotive sector could be challenged by the current backdrop.

Semiconductors are the one key input for all the sectors. Asia-Pacific countries account for about 90% of global semiconductor exports and a handful of countries account for over 70% of global production capacities ( Japan, South Korea, China and Taiwan), which makes the global manufacturing sector very vulnerable to any hiccups. Taiwan, the global leader in semiconductor products, recently increased production, which should allow shortfalls to cool down. Looking more closely, despite volumes higher than in pre-pandemic years, we see that Asia and the US manage to get theirs hands on more semiconductor products than Germany, the leading industrial country in Europe. In the short run, the world should count more on the increase in semiconductor production capacity from Taiwan rather than the US, Europe or China (see Figure 17).

Figure 17 – Summary of industrial policies related to semiconductors in major economies
 Figure 17 – Summary of industrial policies related to semiconductors in major economies
Sources: national sources, Euler Hermes, Allianz Research
China is a key downside risk for Europe: We estimate that a 10% drop in EU imports from China could be a drag of more than -6% on the metal sector, more than -3% on the automotive sector (incl. transport equipment) and more than -1% on computer and electronics. We replicate Nuss & Ciuta (2018) to visualize the supply chains of some key industrial raw materials from the EU perspective, namely aluminum, lithium, iron ore, copper, tin, zinc and magnesium. The resulting visualizations allow us to map a raw material from its import origin to its use in a manufacturing sector (see Figure 18). Countries represented by the dark blue scatter points export a given raw material, represented by the pink scatter points; the size of the link corresponds to the share the country represents in total EU imports. Raw materials are then processed into other materials or used in products (green scatter points). The size of the link corresponds to the share the material represents in the product. Products are then linked to sectors (light blue scatter points) which produce/use them. This enables us to understand the linkages across sectors and countries.

To illustrate, we look at the case of copper. Chile and China are two important partners: Chile accounts for about a third of copper imports and 10% of copper smelter imports while China accounts for about 30% of copper smelter imports in the EU. Close to 20% of copper is used in the production of tubes that are then used in/made by the fabricated metals product sector.

Figure 18 – Visualization of EU supply chains for copper
Sources: Eurostat, Euler Hermes, Allianz Research
Taking a country perspective and focusing on China within our commodities universe, we notice that the country is pivotal for Europe for tin, copper, zinc and magnesium (see Figure 19). Using this network, we estimate elasticities and simulate the impact of a shock represented by the Chinese slowdown between 2015-2016 and Q1 2020 (i.e. a 10% drop in Chinese exports) on EU sector outputs (see Figure 20). Overall, we see that the sectors that would be hit the hardest are the ones related to metals (basic metals and fabricated metal products) and automotive (motor vehicles, trailers and semi-trailers, transport equipment). However, we should note that this impact implies that firms cannot substitute China for other suppliers for these raw materials. In addition, the impact could be stronger through intermediary goods imported from China as well.

Figure 19 – Visualization of EU links with China for selected raw materials
Sources: Eurostat, Euler Hermes, Allianz Research
Figure 20 – Impact of a 10% drop in imports from China on output
Sources: Euler Hermes, Allianz Research
Despite these vulnerabilities, reshoring and nearshoring will remain more talk than walk. Our 2020 supply chain survey showed actual intentions for reshoring were not that widespread among companies in the US and Europe. In fact, looking at indices of distance-weighted imports (see Figure 21) to see if goods are sourced from closer locations, we find no clear trend of reshoring or nearshoring of industrial activities (apart from the UK, which may have been subject to disruptions related to Brexit).

Figure 21 – Distance-weighted imports
Sources: Euler Hermes, Allianz Research
Looking at US-China relations in particular, we see a low likelihood of escalation in the trade tariff dispute after purchase commitments of the Phase One Deal expire in 2022, as long as supply-chain bottlenecks remain. This is even more important as the Regional Comprehensive Economic Partnership (among ASEAN+5) will enter into force on 1 January 2022 and could further increase regional integration in Asia at the expense of the US and Europe.

However, protectionism reached a record high in 2021 and should remain elevated, mainly in the form of non-tariff trade barriers (e.g. subsidies, industrial policies).

We expect global trade in volume to gradually return to its pre-crisis long-term average, with growth at +5.4% in 2022 and +4.0% in 2023, after +8.3% in 2021. And while acute input shortages coupled with higher shipping costs and a strong dollar pushed up price effects in 2021 (growth in value terms expected at +18.8% in 2021), we expect this trend in price growth to reverse in 2022 to below 2017-18 highs (see Figure 22).

But watch out for increased global imbalances: The US will register record-high trade deficits (around USD1.3trn in 2022-2023), mirrored by a record-high trade surplus in China (USD760bn on average). Meanwhile the Eurozone will also see a higher-than-average surplus of around USD330bn.

Figure 22 – Global trade growth (%)

Figure 22 – Global trade growth (%)
Sources: Euler Hermes, Allianz Research

In terms of export gains (see Figure 23), Asia-Pacific should continue to be the main winner in the coming few years, with gains adding up to more than USD3trn over 2021-2023 (after an USD420bn loss in 2020). More than half of these gains is likely to be achieved in 2021, followed by gains amounting to USD630bn in 2022 and USD710bn in 2023. European exporters’ performance in aggregate terms over 2021-2023 could be similar to that of Asia-Pacific, although these gains follow a much sharper contraction in exports in 2020. Finally, North America’s export gains are expected to reach close to USD800bn over 2021-2023 (after a close to USD500bn loss in 2020).

Figure 23 – Trade by region, yearly change (USDbn)

Figure 23 – Trade by region, yearly change (USDbn)
Sources: Euler Hermes, Allianz Research
At a sector level, price effects are not fading everywhere despite base effects. The outperformers of 2021 should continue to see strong exports in 2022, in particular the energy, electronics and machinery & equipment sectors. The main export winner in 2023 should be automotive, thanks to the backlog of work and lower capex in 2021 (see Figure ­24).

Figure 24 – Trade by sector, yearly change (USDbn)
Sources: Euler Hermes, Allianz Research