Corporate risk in the US and Eurozone

Double trouble? Inflation means less cash and more debt for companies

07 September 2022

EXECUTIVE SUMMARY

  • The post-pandemic party is coming to a close. While the latest earnings season was better than expected on the revenue side, with only four out of 24 sectors posting a decline, half reported y/y declines in earnings. Forecasts and guidance also indicate fading momentum: Q3 revenue growth rates have been revised downwards for Latin America, APAC and emerging markets, and for 15 sectors globally.
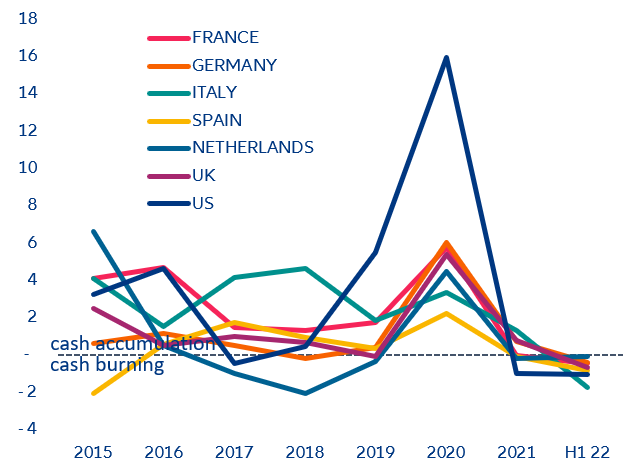
  • Cash buffers are still high but waning.  Despite exceeding 2019 levels by 30% in Europe and 50% in the US as of Q2 2022, cash buffers are decreasing as most firms in both the US and Europe have been burning cash in 2022.
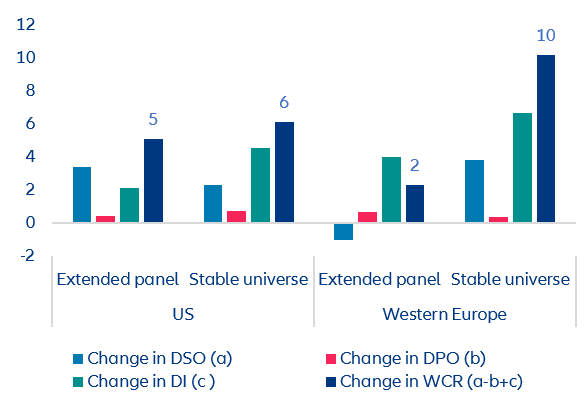
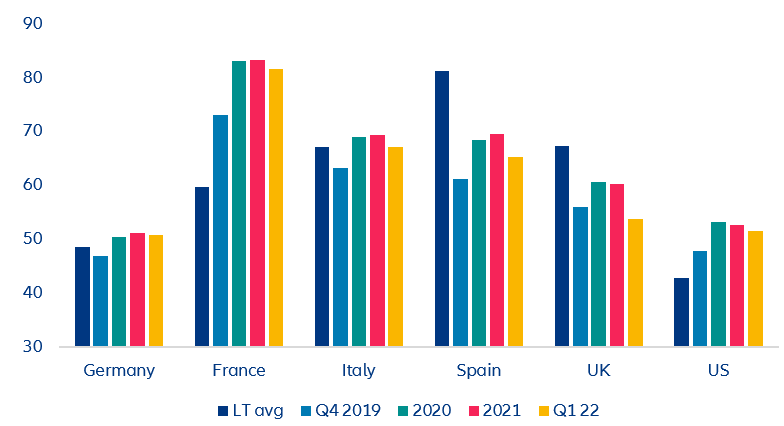
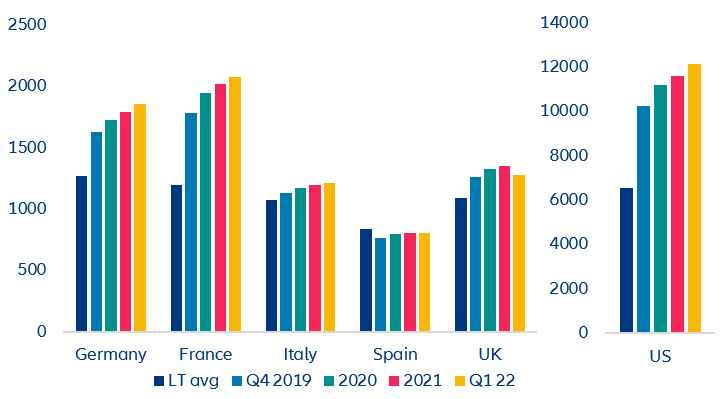
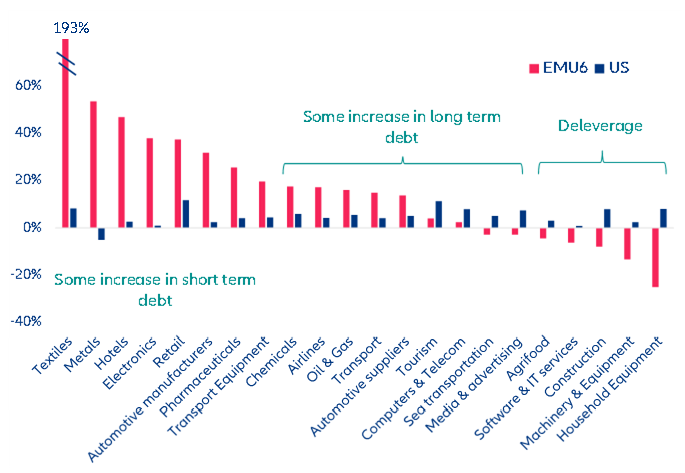
  • Due to the inflationary environment, working capital requirements (WCR) climbed +6 days of turnover to reach 71 in the US and +10 days to 64 in Europe. This has led firms to build up leverage. Meanwhile, higher interest rates are also pushing up interest expenses, especially in Europe (+20% adjusted for change in long term debt).
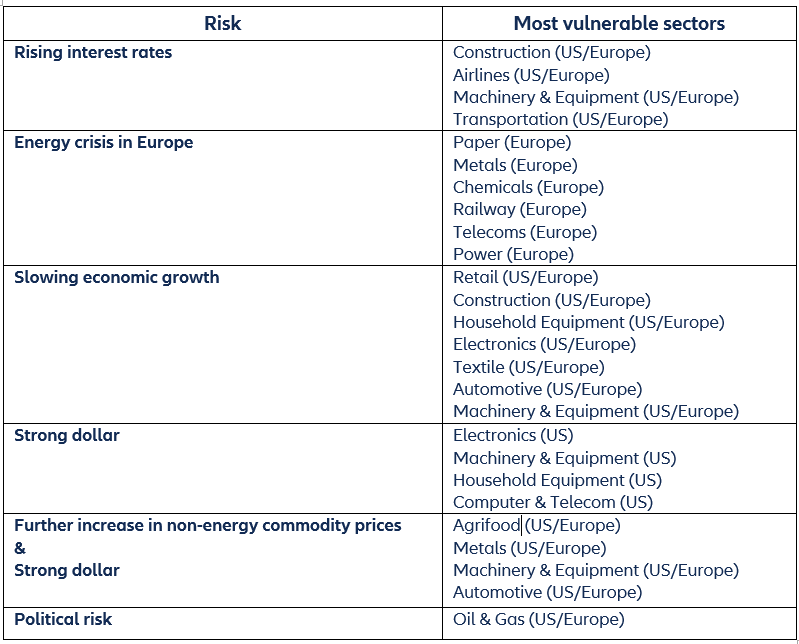
  • As a result, countries, sectors and firms now face different challenges. The energy crisis could be a major blow in Europe for energy-intensive sectors (Power, Paper, Metals, Railways, Chemicals etc.) while the strong dollar could harm exporting sectors in the US. Discretionary spending and construction are also at risk while energy should continue to fare well – although it is at risk of facing political action (e.g. a “superprofit” tax).

Earnings held steady in the first half of 2022 but momentum is fading.

The Q2 earnings season brought positive surprises globally, with more than half of listed companies beating consensus estimates for revenue and earnings per share (58% and 54%, respectively). However, expectations were widely revised downwards some weeks before the earnings releases due to the continued war in Ukraine, persistent supply-chain issues and semiconductor shortages caused by lockdowns in China, as well as increasing raw material prices.

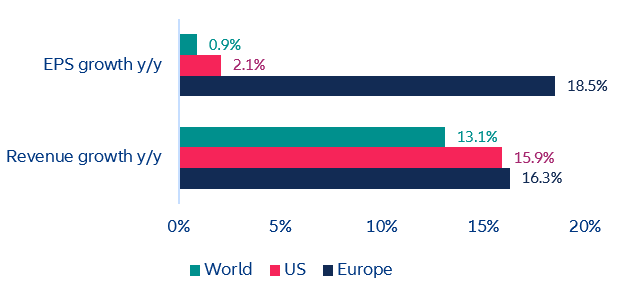
Europe was the region that surprised the most. Despite the proximity to the Russia-Ukraine conflict, 64% of European companies exceeded revenue expectations and the average revenue growth rate was +16.4% y/y (+12.5% y/y in the Eurozone). In the US, 63% of firms also beat estimates, with revenue growing by +15.9% y/y. However, there was a larger gap between corporates on both sides of the Atlantic when it comes to reported EPS: While earnings grew by +18.5% y/y in Europe (+4.7% y/y in the Eurozone), they rose by only +2.1% in the US (+0.9% y/y world average). This indicates that companies on the Old Continent were better able to absorb increasing production costs compared to their American peers.

Figure 1: Revenue and EPS growth rates by region in Q2 2022

Figure 1: Revenue and EPS growth rates by region in Q2 2022
Sources: Refinitiv Eikon, as of 30 August 2022, Allianz Research

Some sectors performed better than others. Energy and transportation in particular (together representing around 9% of the volume of reporting companies) saw revenue grew by +62.3% y/y and +31.5% y/y, respectively, at the global level. In contrast, automotive (-11.6% y/y) suffered the most in Europe due to lower production volumes amid persistent shortages of semiconductors. In the US, the telecommunication sector was the only non-financial sector unable to grow its Q2 revenues (-13.6% y/y) as intense competition prevented companies from passing through rising energy costs to customers (see Figure 2).

Figure 2: Q2 revenue growth rates by sector

Figure 2: Q2 revenue growth rates by sector
Sources: Refinitiv Eikon, as of 30 August 2022, Allianz Research

Looking ahead, we expect a general deterioration in corporate results in Q3 and Q4, especially in the US, where inflation issues (and therefore hawkish monetary policy) began much earlier than in Europe, slowing consumption down faster. US companies with an international
presence will also face a negative impact on revenues caused by the stronger US dollar.
Other continuing disruptions such as the supply-chain bottlenecks and the political tensions in Ukraine and Taiwan could also continue to affect business sentiment.

The mean estimate for Q3 revenue growth has slightly shifted to the upside (+0.9%) for Europe to the downside for the US (-0.2%). When looking at the revisions to net profits, the mean change for EPS has been positive for Europe (+2.0%) but negative fo r the US (-2.3%). Indeed, the average profit-growth estimate for S&P 500 companies has reduced to +7.2% as of August, compared to +11.1% in July (see Figure 3).

Figure 3: S&P 500 profit-growth estimates for 2022 and 2023 (July vs August consensus)

Figure 3: S&P 500 profit-growth estimates for 2022 and 2023 (July vs August consensus)
Sources: Refinitiv Eikon, Allianz Research

In many countries companies are starting to burn cash.

Non-financial corporates’ cash holdings reached new highs in the first half of 2022, exceeding 2019 levels by 30% in the Eurozone (EUR788bn) and 55% in the US (USD835bn – see Figure 4). Indeed, NFC deposits kept on increasing across all European countries in the first part of the year, with still noticeable rises as of July and new records set notably in core countries: Germany (+4.9% y/y to EUR765bn), France (+4% to EUR927bn), Italy (+5.7% to EUR440bn), Spain (+6.9% to EUR328bn) and the UK (+4.3% to GBP583bn). In the US, the increase in deposits accelerated strongly in Q1 by +11.5% y/y, pushing the total deposits of US firms above USD2,300bn, compared to EUR3,437bn for the total deposits of Eurozone firms.

Figure 4 – Increase in total deposits held by NFCs, last* vs December 2019

Figure 4 – Increase in total deposits held by NFCs, last* vs December 2019
(*) July for Eurozone countries and UK, and Q1 for the US
Source: ECB, BoE, FRED, Allianz Research

However, part of these increases in cash balances comes from new bank loans taken out either proactively or defensively. De facto, changes in net cash positions, measured by the difference between NFC deposits and new loans, decelerated noticeably from 2020 to 2021 and again in H1 2022. For the top five markets of the Eurozone, the momentum dropped to 2% in H1 2022, from 7% in 2021 and 14% in 2020. The outcome is similar for the UK (1%, 14% and 19%, respectively) and slightly worse for the US (0%, 6% and 23% respectively). For most countries, this means that the increase in economic activity already started to generate a smaller increase in cash positions. Indeed, our cash-burning index[1] turned negative in H1 2022 in the UK and Germany, and confirmed the negative turn begun in 2021 in France, Spain, the Netherlands and the US (see Figure 5).

Figure 5 – Cash-burning index, by country

Figure 5 – Cash-burning index, by country
Sources: ECB, BoE, FRED, Allianz Research

Inflation-induced WCR increases are leading to higher debt and higher interest expenses.

Part of the acceleration in cash burning is related to the increased Working Capital Requirements caused by the impact of supply-chain bottlenecks on inventories and, more importantly, higher input prices. The financials of listed firms show that inventories surged in Q1, particularly in Europe, and remained more or less flat in Q2 both in Europe and the US. For H1 2022 overall, inventories were up by +5 days of turnover in the US and +7 days in Europe, compared to end of 2021. This increase in inventories contributed to 66% of the rise in WCR in Europe and 75% in the US. The rest is explained by the net changes in payment behaviors on receivables (DSO) and payables (DPO), with larger increases in DSO in the US and Western Europe. All in all, this inflation-induced rise in WCR rose +6 days of turnover to 71 in the US and +10 days to 64 in Western Europe (see Figure 6).

Figure 6: Change in WCR components in H1 2022, in number of days in turnover

Figure 6: Change in WCR components in H1 2022, in number of days in turnover
(*) as of 31 August 2022, considering the financials of 2,012 companies for which detailed Q2 results (i.e. earnings + balance sheets) are available (extended panel), and 1,920 companies when using a stable panel of reporting companies (stable universe).
Sources: Eikon/Refinitiv, Allianz Research

This context is pressuring firms to remain highly leveraged. Despite the decrease in debt ratios posted in Q1 2022, largely due to growth in nominal GDP, financial debt ratios still exceed pre-pandemic levels (see Figure 7). In absolute terms, the financial debt of NFCs has hit new records in most countries, notably Germany (EUR1,860bn), France (EUR2,074bn) and the US (USD12,138bn – see Figure 8). 

Figure 7: NFC debt ratio, in % of GDP

Figure 7: NFC debt ratio, in % of GDP
Sources: Banque de France, Allianz Research
Figure 8: NFC debt, in LCU
Sources: Banque de France, Allianz Research

Moreover, as interest rates are rising, interest expenses are also intensifying. Between Q1 and Q2, interest expenses rose quite sharply for firms in the six largest Eurozone economies (+16% for our panel). Notably, they almost tripled for the textile sector, and increased by about +50% for metals, electronics and hotels. In the US, the rise has been less pronounced (average of +3%), except for the machinery and equipment sector, which faced a +56% increase. However, when adjusting for changes in long-term debt, the picture looks very different: We see that the rise in interest expenses in Europe is mostly driven by WCR while in the US it is mostly due to an increase in longer-term debt (see Figure 9). Note also that the household equipment sector in the Eurozone has started to deleverage, signaling a slowdown in activity and demand for durable goods.

Figure 9: Change in interest expenses (Q2 vs Q1) adjusted for change in long-term debt

Figure 9: Change in interest expenses (Q2 vs Q1) adjusted for change in long-term debt
Sources: Refinitiv, Allianz Research

Each boat has its own route: countries, sectors and firms now have very different challenges.

Most companies, regions and sectors suffered from the Covid-19 crisis and benefited from the release of pent-up demand. However, in 2022, sectors are now facing very specific challenges. Cash positions and debt also underline different dynamics. While the risk of an economic slowdown is bad news for corporates on both sides of the Atlantic, cyclical sectors are more exposed (e.g. retail, textiles, construction). The energy crisis is a European topic, with firms facing existential threats as they worry about access to energy. In the US, however, it is mostly an input cost topic that could push up expenses. Similarly, rising interest rates will hit highly leveraged sectors harder (e.g. construction, airlines). And the strong dollar is mostly a hurdle for US exporting sectors (e.g. household equipment, machinery & equipment). Finally, the oil & gas sector alone is facing political pressures, with potentially higher taxes in Europe to fund fiscal measures and growing pressure from the Biden Administration in the US to invest in refining capacity. The Power sector in Europe is under tremendous pressure however it is and will be heavily supported by policy as the sector is too important to fail.

Table 1 – Summary table of risks & vulnerable sectors

Table 1 – Summary table of risks & vulnerable sectors
Source: Allianz Research