EXECUTIVE SUMMARY

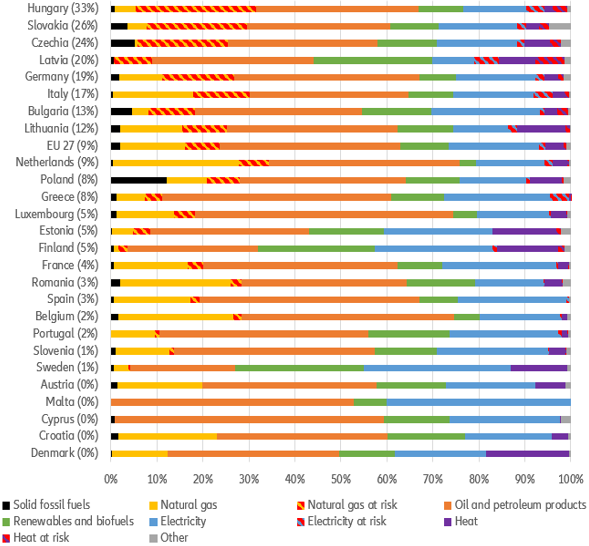
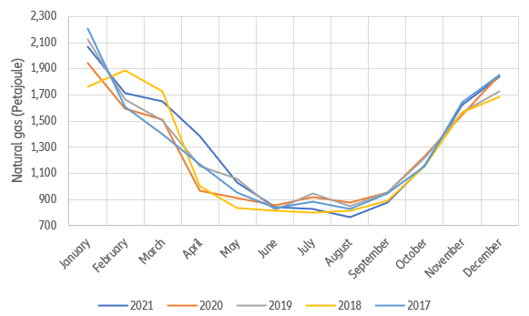
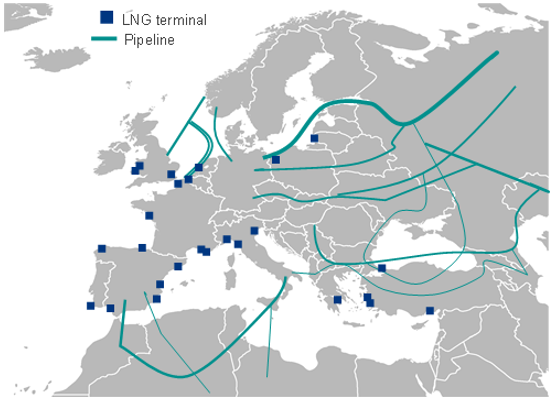
  • Giving up gas imports from Russia, which account for 36% of total EU gas supply, will not be easy for Europe. We estimate the amount of energy at risk across the EU at almost 10% of final consumption. In Hungary, Slovakia, Czechia, Latvia and Germany, more than 20% of final energy consumption depends on gas from Russia.   In the short run, according to our calculations, Europe has about one month of supply in reserves, which should take it until end-March, thanks to the relatively mild winter. But the EU will need to replenish stocks ahead of next winter. Switching suppliers - which could help bridge another one-two weeks - calls for markedly boosting imports from other countries, increasing the supply of other energetic substitutes and/or reducing demand for gas (natural gas as well as electricity and heat produced from natural gas).
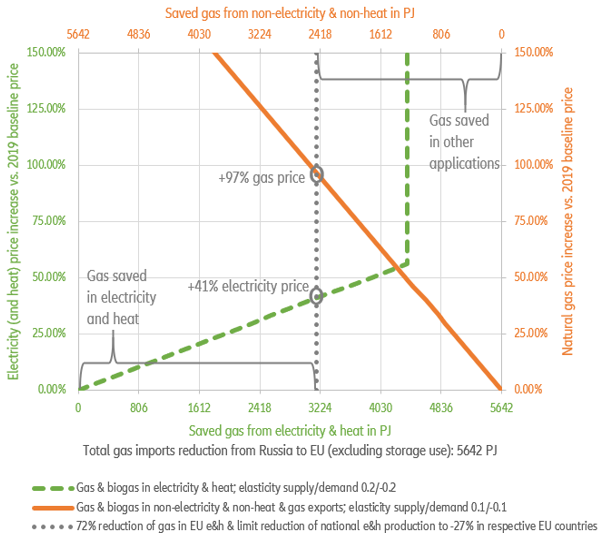
  • Drawing parallels to the 27% loss of electricity from nuclear power in Japan after Fukushima, and analyzing the reaction of supply and demand to price increases, we find that the expectation of a lasting +40% electricity price increase and a +100% gas price increase would reduce demand by between 8-10% and increase supply of energy from natural gas and its substitutes by 8-10% in the short-term to compensate for the total loss of Russian gas imports. The EU retail price increase of +30% for electricity and +50% for gas in the 12 months up until January 2022 is already a move in this direction.
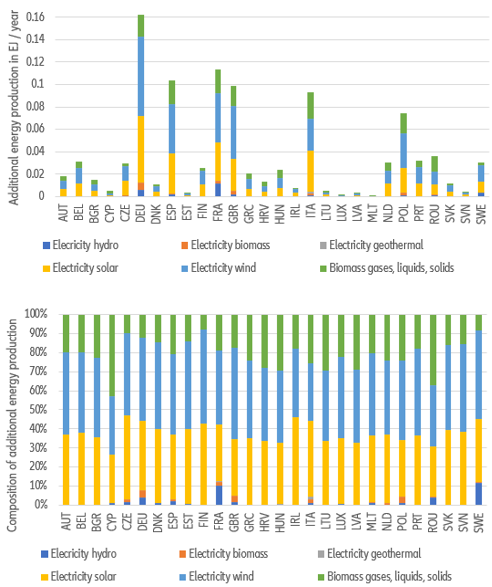
  • Now more than ever, Europe needs an ambitious and coordinated action plan to ensure energy security for the next winter. Regaining energy sovereignty calls for a commitment to expand renewable energy production in the EU by 1 exajoule (278 TWh) per year or by the amount of Russian gas imports within six years. This would require annual investments of EUR170bn or 1.3% of EU GDP. Our proposal includes the addition of 44 TWh per year for the largest contributor, Germany, which is in line with the mid-term goals of the announced revision of the German renewable energy law. 

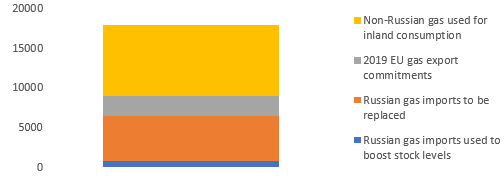
It will not be easy for Europe to do without gas imports from Russia, which account for close to 36% of total EU gas supply. Hungary, Slovakia and Czechia have the highest shares of energy consumption at risk. In 2019 , domestically produced and imported natural gas, biogas and LNG in the EU added up to a total of 17800 PJ energy from methane. Out of that, Russian imports constituted 36%. Subtracting from the imports the amount used to bolster stock levels (i.e. 700 PJ) leaves us with around 5600 PJ of Russian gas that will need to be replaced should Europe decide to put a ban on gas imports or Russian authorities decide to retaliate against sanctions by shutting down gas exports to Europe . Factoring in the EU's 2019 gas exports of 2500 PJ, a total of 14600 PJ (17800 PJ -700 PJ - 2500 PJ) of gross available energy from methane (including biogas) was used for inland consumption. It is assumed the EU will want to continue to meet similar levels of gas exports.

Figure 1 - Total EU gross available energy from methane (in PJ)

Figure 1 - Total EU gross available energy from methane (in PJ)
Source: Euler Hermes, Allianz Research

The importance of natural gas varies widely among EU members and even those relying on natural gas might not depend on Russian imports. Figure 2 shows that Hungary, Slovakia and Czechia display the highest dependence on Russia, with 33%, 26% and 24%, respectively, of cumulative energy consumption at risk, be it directly from final gas consumption or indirectly from the consumption of electricity or purchased heat. The figure follows the common convention of allocating Russian gas fully to the country of the physical entry of the pipeline. Alternative approaches instead attempt to capture the redistribution of the gas between EU countries. One assessment using such an approach is displayed in Annex 1.

In the short run, the warmer weather ahead could reduce Russian authorities’ leverage. We estimate that Europe currently has about one month of supply in reserves, which should take it until end-March, thanks to the relatively mild winter. The consumption pattern displayed in Figure 3 is surprisingly robust, with peak consumption of around 2000 PJ in January dropping to under 900 PJ in June. This delays the urgency to replace potential losses in imports, but only if imports reach pre-crisis levels in autumn again. In case of lasting disruptions, the low consumption in summer gives some room to replenish gas reserves for next winter.

Figure 2: Final consumption of energy at risk

Figure 2: Final consumption of energy at risk
Source: Euler Hermes, Allianz Research calculations, Eurostat data
Figure 3: Gas consumption by month in the EU
Source: Euler Hermes, Allianz Research calculations, Eurostat data

Overall EU reserves stood at about 29% of total capacities as of 28 February – this is roughly about 1.2mn terajoules of energy. In one typical month of winter, the EU consumes about 1.4mn-1.5mn terajoules of energy from natural gas. Accounting for the LNG en route to Europe, the possibility to tap-in in “cushion gas” and current reserves, the region should be able to meet power demand until end-March.  In a scenario where Russia turns off Europe’s gas supply – though this did not happen even during the height of the cold war – the natural gas price could peak up to 200 EUR/MWh in the coming months, with seasonality and some price consolidation from spring, it could take average prices for 2022 to circa 150 EUR/MWh. As of 2 March, markets were considering a supply crunch as a possibility, with next month’s contract prices reaching 165 EUR/MWh.

Looking beyond spring, the EU will need to replenish stocks ahead of the next winter. But switching suppliers isn’t easy.  Despite tentative attempts by the US and the EU to search for contingency plans via diplomatic channels with other producers (i.e. Qatar, Algeria) adding significant extra volumes will be difficult. Moreover, according to our calculations, hypothetical extra volumes would only give the EU the equivalent of three days of winter consumption .

In addition, more than 80% of storage capacity has been designed to keep natural gas in gaseous form, meaning that the continent will need to rely on suppliers connected to the current EU network, which are limited to a few countries (see Figure 4). Port terminals that can receive, store and gasify LNG are also limited and cannot be built overnight as they require special infrastructure with cooling capacities etc.

Figure 4:  Pipelines and LNG terminals in Europe

Figure 4:  Pipelines and LNG terminals in Europe
Sources:  ENTSOG, European Commission, Euler Hermes, Allianz Research

In this context, the other option is to reduce gas use for electricity generation, given that electricity derived from different production technologies is a homogeneous and substitutable product that can be easily redistributed across Europe. In addition, gas power plants can partially substitute oil for gas, and the electricity sector has manifold options to increase supply, including reviving coal power plants in the capacity reserve (though coal imports might as well be at risk), delaying the phase-out of nuclear power plants and coal power plants and utilizing non-gas power plants that are currently used for balancing power provision at much higher than usual rates.

A halt in Russian gas imports would constitute an ‘emergency level’ event in the ‘gas emergency plans’ of EU countries. In an emergency event in which all relevant market-based measures have been implemented but the gas supply is insufficient to meet the remaining gas demand, the emergency response will escalate to include non-market-based measures with a view, in particular, to safeguarding gas supplies for protected customers, which include household customers, customers providing essential social services and district heating systems that deliver heat to the previously mentioned groups. Non-market measures constitute rules on the production, transport, storage, distribution, sale, purchase, use and maximum prices for gaseous fuels, including rationing in terms of time, place or quantity, or limiting sales to certain priority supply purposes. Where possible, fuel-switching capabilities will be utilized. Emergency plans also often include shutting down large industrial and commercial consumers in case of an acute, but not long-lasting disruption. It is to be seen how to handle this in case the current crisis lasts over months or years.

The unfortunate events in Fukushima in March 2011 provide a real live example of what happens when a huge chuck of electricity generation capacity is shut down. Whereas in 2010, around 27% of electricity in Japan was produced by nuclear energy, by 2012 that share dropped to 0%. In 2019, in the EU, 19.6% of electricity was produced from natural gas (or 22.5% if electricity and heat is combined). The Japanese phase-out was demanding, costly and painful, but the massive black-outs and disastrous scenarios predicted by many before the phase-out did not materialize. The production costs of electricity increased by +41% , the demand for electricity dropped by around -7% and the electricity supply from non-nuclear sources increased by around +19% to close the remaining gap.

Figure 5: How to save gas equivalent to Russian natural gas imports. Gas saved for electricity production vs. other uses of gas for increases in electricity and in natural gas prices

Figure 5: How to save gas equivalent to Russian natural gas imports. Gas saved for electricity production vs. other uses of gas for increases in electricity and in natural gas prices
Source: Euler Hermes, Allianz Research
The EU uses 4388 PJ of natural gas for the production of electricity and heat . Figure 5 analyzes the effect of price increases on the demand of natural gas and the supply of its alternatives. Assuming a value of 0.2 for the short-run supply elasticity and -0.2 for the short-run demand elasticity of electricity, as shown as the bold green dashed line, a price increase of +56% for electricity would induce a -11.2% demand drop of total electricity as well as a +11.2% supply increase in the non-gas electricity supply . That would practically eliminate the need for producing the 22.5% of electricity from natural gas in the 2019 electricity mix. This would leave 1254 PJ (5642 PJ – 4388 PJ) of Russian gas that still needs to be replaced, which is equal to 2% of the EU’s 61042 PJ gross inland energy consumption. For this, a solution seems feasible . The literature indeed indicates that the lower end of demand elasticities for natural gas lies at -0.1 . In addition, there is probably some scope of increasing methane supply from alternative sources to Russian gas, which we assume to display an elasticity of 0.1.

Figure 5 displays the effect of a price increase of natural gas on the consumption of gas in the bold brown line (the effect should be read from the left). Sticking to the +56% increase in the electricity price from above, a +50% price increase of natural gas relative to 2019 levels would lead to a sufficient adjustment in supply and demand to close the gap created by missing natural gas imports. Of course, for these adjustments to fully materialize, consumers and producers have to expect the price changes to be permanent.

Unfortunately, this will be hard to realize since some EU countries have very high national production shares of electricity from natural gas. Limiting the national reduction goal in each EU country in electricity as well as in heat production to -27% (as observed due to the Fukushima accident in Japan) would mean that an EU average of 28% of gas power plant capacity has to stay in service. The dotted grey line shows the resulting outcome, with 1211 PJ of natural gas still being used for electricity and heat (and 3177 saved) and thus 2465 PJ needed to be saved in other applications. Consequently, the electricity price would have to increase by +41% (decreasing electricity demand by -8% and increasing supply from gas substitutes by 8%) and the gas price by +97% (decreasing demand by -10% and increasing supply from alternatives by 10%). This would imply an intra-EU redistribution of funds if the burden of the asymmetric effort is to be shared fairly. From January 2021 to January 2022, we could observe increases for EU retail prices of +31% for electricity (from EUR182-238 per MWh) and of +49% for gas (from EUR65-97 per MWh). If consumers and producers perceive these price increases as lasting and adjust their expectations accordingly, we should already see a partial adjustment in the short-term. Figure 2 in the Annex shows a further sensitivity analysis, with for example the light dotted grey line displaying an equal reduction in gas utilization of -33% (the Russian gas share before exports) in all gas uses. This would require a +19% increase in electricity prices and a +165% increase in the natural gas price, relative to 2019 prices, to compensate for the reduced gas supply.

Figure 6: Distribution of the additional 1 exajoule of energy production in support of energy sovereignty
Figure 5: How to save gas equivalent to Russian natural gas imports. Gas saved for electricity production vs. other uses of gas for increases in electricity and in natural gas prices
Source: Allianz Research. NGFS data

In this context, Europe needs an ambitious and coordinated action plan to ensure energy security for the next winter. In the medium term, the energy gap can be filled at reasonable cost with renewable energy. If current fossil energy price levels persist, and as future volatility of fossil energy prices can be expected to stay high, renewables are by far the cheapest option to supply energy and the prime choice to advance energy sovereignty in the EU.
However, an ambitious and coordinated action plan for energy security is needed. This includes committing to a quick and complete phase-out of all fossil fuel imports from locations that are questionable from a national security point of view. Only then will the European economy be able to plan and react accordingly. But even more, it requires committing to expand renewable energy production in the EU by 1 exajoule per year (1 exajoule equals 1000 petajoules above or about 278 TWh). This would, for example, allow for the extension the energy production by roughly the 6 exajoules of Russian gas imports over six years. Figure 6 displays how the additional 1 exajoule of energy production per year is distributed among technologies and EU countries. These are based on the average yearly increases of these technologies in the NGFS “REMIND Divergent Net-Zero” scenario from 2021 to 2030, which sum up to exactly 1 exajoule . The associated investment needs for the addition of the renewable production facilities sum up to EUR170bn per year, which constitutes 1.3% of the EU’s GDP.

In the figure, we can see that Germany is supposed to be in the lead with 0.16 exajoules of additional annual renewable energy, which is equivalent to 44 TWh. The current draft law for the revision of the German renewable energy law (which should be adopted in March) commits to an expansion from 230 TWh (41% renewable of 560 TWh total) in 2021 to 572 TWh (80% renewable of 715 TWh total) in 2030 or on average about 28 TWh per year. But the annual additional joint installed capacity (not production, but production is proportional to capacity) in wind and solar gradually ramps up from 10.5 GW in 2022 to 36 GW in 2029 and is kept up thereafter, so that the suggested increase of 44 TWh of renewable energy production per year is within reach.