Executive Summary
- The Covid-19 crisis is morphing into a payment crisis as companies tend to protect their working capital by paying their suppliers late. Defaults and insolvencies loom ahead. Companies need to understand structural payment patterns to help them triage bad payers from the good ones in finding their way back to growth. The Euler Hermes’ Country Risk database serves this purpose.
- In this paper, we used Euler Hermes unique dataset of international trade flows and payment defaults to explore the relationship between national culture and payment defaults between companies. We found that importers located in countries where society accepts and expects that power is distributed unequally tend to have a higher default ratio. The role of national culture is robust to the use of alternative indicators, such as the World Bank’s Resolving Insolvency indicator, and to the inclusion of the geographic and cultural distances between the importer and the exporter. Those findings are consistent with previous results based on mortgage default and tax evasion, and confirm the role of national culture in cross-country differences in behavior concerning non-payments.
- In other words, the strength of societal and social hierarchy matters for insured trade credit defaults. Using power as a proxy for B2B non-payments, the 10 countries on your accounts receivables watch list should be: Malaysia, Slovakia, Guatemala, Panama, the Philippines, Russia, Romania, Serbia, Mexico and China. Conversely, the following 10 countries exhibit equally distributed power (and reduced default risk): Austria, Israel, Denmark, New Zealand, Ireland, Norway, Sweden, Finland, Switzerland, and Germany. Understanding the power structure in your clients’ country can become a useful compass during the Covid-19 crisis.
Trade credit insurance protects suppliers against the risk of non-payment by their customers. In 2017, private trade credit insurance covered more than EUR2.3trn of domestic and international trade , representing approximately 10% of global trade. The increasing importance oftrade credit insurance since the early 1990s has led to a burgeoning literature on the relationship between trade credit insurance, trade volume and export performance (Felbermayr & Yalcin 2013, Auboin & Engemann 2014, Van der Veer 2015). While there is a consensus on the positive impact of trade credit insurance on trade developments, little is known on the determinants of international and domestic insured trade credit defaults. Indeed, an increase in claims might lead credit insurers to reduce their exposure and/or to increase the premium of export credit insurance (Van der Veer 2019), and thus, in turn, might impact trade volume.
In this paper, we explore the determinants of trade credit defaults by using an extensive dataset of more than 7 million records from Euler Hermes. Following the recent findings from Tajaddini & Gholipour (2017) on the relation between national culture and default on mortgages, we use the Hofstede (1984) cultural dimensions for 40 countries to test the hypothesis that payment defaults are more frequent in countries with a high power distance index, high individualism, high uncertainty avoidance and high masculinity. After controlling for sectoral composition differences, we confirm that importers located in countries where the society accepts and expects that power is distributed unequally (high power distance) have a higher default ratio. In contrast, individualism, uncertainty avoidance and masculinity have no impact on payment defaults. Those findings are robust to the inclusion of additional control variables, such as geographic distance (in kilometers), cultural distance measured by differences in languages, the World Bank’s “Resolving Insolvency” indicator and the inclusion of macroeconomic variables. The positive impact of national culture is consistent with previous findings showing that a higher power distance is associated with an increase in mortgage default (Tajaddini & Gholipour 2017), a larger level of tax evasion (Tsakumis et al. 2007, Gabor 2012) and a higher acquirers’ post-merger default risk (Koerniadi et al. 2015). Our results confirm the role of national culture in cross-country differences in behavior concerning non-payments.
We use the “Trade Flows Payment Defaults” data from Euler Hermes, the world’s largest credit insurance company (36.1% of market share in 2017). Since February 2019, Euler Hermes has provided open access to some of its data on international trade on its website. The “Trade Flows Payment Defaults” data are available for the years 2016, 2017 and 2018 and provide a snapshot of trade flows and payment defaults between importing and exporting countries. The dataset includes: (1) the given month, (2) the importer/buying country, (3) the exporter/selling country, (4) the importer company trade sector NACE code rev.1.1, (5) the total of trade flows (in euros) declared to Euler Hermes in the given month, (6) the total of payment defaults (in euros) declared to Euler Hermes in the given month and (7) the risk indicator of the given buyer population. The dataset includes 2,835,119 observations (month-importer-exporter-sector) for the year 2016, 2,901,867 for the year 2017, and 2,504,716 for the year 2018. The country with the highest number of observations and the highest trade flows is France, followed by Germany and the U.S..
We compute the loss ratio as the sum of payment defaults from customers in country i to suppliers in country j divided by the total trade flows between customers in country i and suppliers in country j. We compute for each i,j pair the percentage of trade flows that belong to a list of 16 sectors by using the Statistical Classification of Economic Activities in the European Community (NACE code) and a correspondence table between NACE codes and trade sectors provided by Euler Hermes on its open data website.3 We consider the following sectors: retail, agrifood, household equipment, machinery equipment, commodities, transport, automotive manufacturers, services, construction, computers telecom, textiles, chemicals, metals, electronics, paper, automotive suppliers, software IT services, pharmaceuticals, transport equipment and energy.
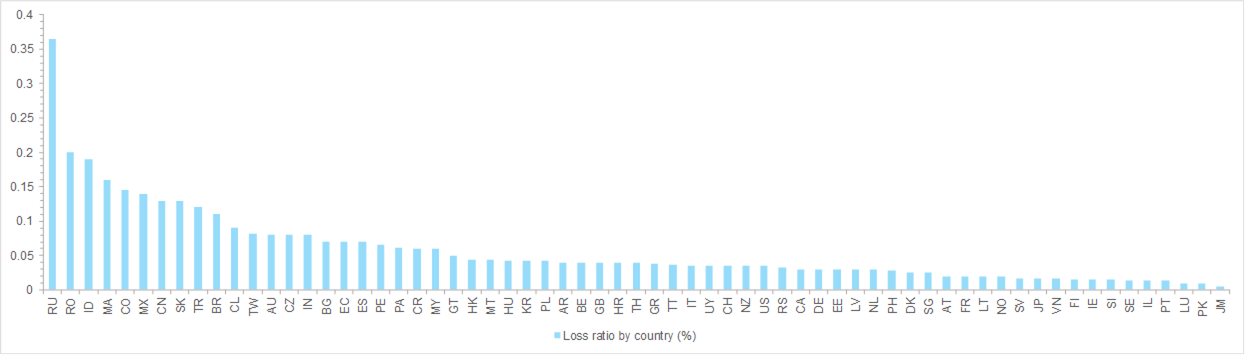
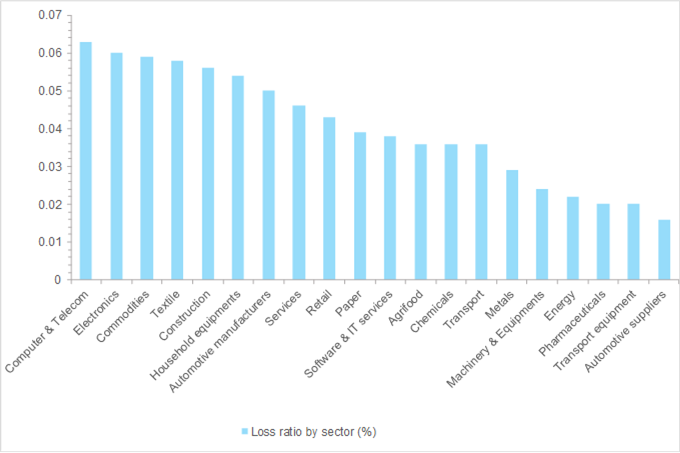
A simple univariate analysis suggests large differences across countries and sectors. Figure 1 presents the loss ratio by country, and Figure 2 the loss ratio by sector. The loss ratio is the highest in Russia (0.37%), followed by Romania (0.21%), the United Arab Emirates (0.17%), Morocco (0.15%), Turkey (0.14%), Colombia (0.14%), Mexico (0.13%) and China (0.13%). It is the lowest in Luxembourg (0.01%), Portugal (0.01%), Norway (0.02%), Israel (0.02%), and Sweden (0.02%). With regard to sectors, the loss ratio is the highest in the following sectors: computers telecom (0.07%), electronics (0.06%) and textiles (0.06%).It is the lowest in automotive suppliers (0.02%), transport equipment (0.02%) and pharmaceuticals (0.02%).
We download data on cultural dimensions of Hofstede (1984) from Professor Hostefede website4. The four dimensions of culture proposed by Hostefede (power distance, uncertainty avoidance, individualism, and masculinity) have been used in the literature to analyze the impact of national culture on mortgage default (Tajaddini & Gholipour 2017), on tax evasion (Tsakumis et al. 2007, Gabor 2012) and on acquirers’ post-merger default risk (Koerniadi et al. 2015). Power distance expresses the degree to which the less powerful members of a society accept and expect that power is distributed unequally. Uncertainty avoidance expresses the degree to which the members of a society feel uncomfortable with uncertainty and ambiguity. In Hofstede’s framework, the ‘masculinity’ dimension is used to categorize societies with a preference for “achievement, heroism, assertiveness, and material rewards for success”, in contrast to ‘feminine’ societies with a “preference for cooperation, modesty, caring for the weak and quality of life”. While a distinction can indeed be drawn between two kinds of national cultures, those that are more focused on individual competition and success, and those that prioritizes a cooperative effort towards a better quality of life, we acknowledge that the term ‘masculinity’ in this context reinforces gender stereotypes. Our use of the term in this study is only to adhere to the official wording of the framework. The last dimension, individualism, is explicit.
Figure 1: Loss ratio (%) by importer country (2016-2018)