Executive summary
- The war in Ukraine and new lockdowns in China have significantly deteriorated the balance of risks for companies. The shockwaves are visible in the extended supply-chain disruptions and transportation bottlenecks, as well as high input costs and shortages, notably for energy and commodities but also labor. To add to this, the global surge in inflation is accelerating monetary tightening, which will increase funding costs for companies.
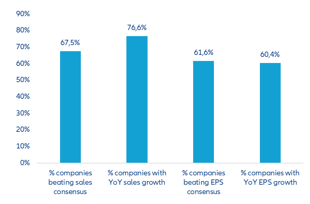
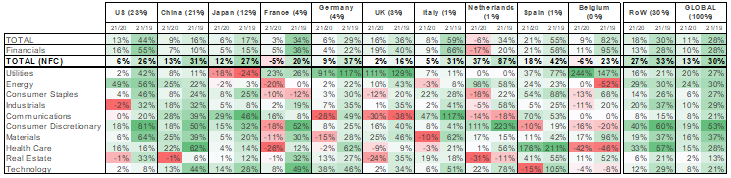
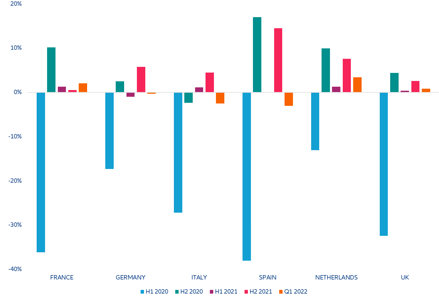
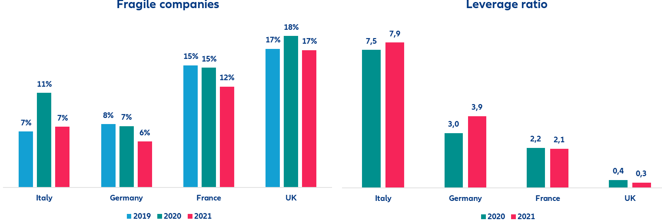
- In the very short term, three signs of resilience should help prevent a massive surge in insolvencies. At the global level, the total cash holdings of listed firms was 30% higher at the start of 2022 than in 2019, and deposits of non-financial corporates (NFC) were 29% higher in the Eurozone and as much as 57% higher in the US. Our proprietary data also show that the number of fragile firms has decreased, particularly in Italy (to 7% from 11%) and France (to 12% from 15%). In addition, the Q1 2022 earning season confirmed that listed companies have been far more capable of passing cost increases onto prices than expected.
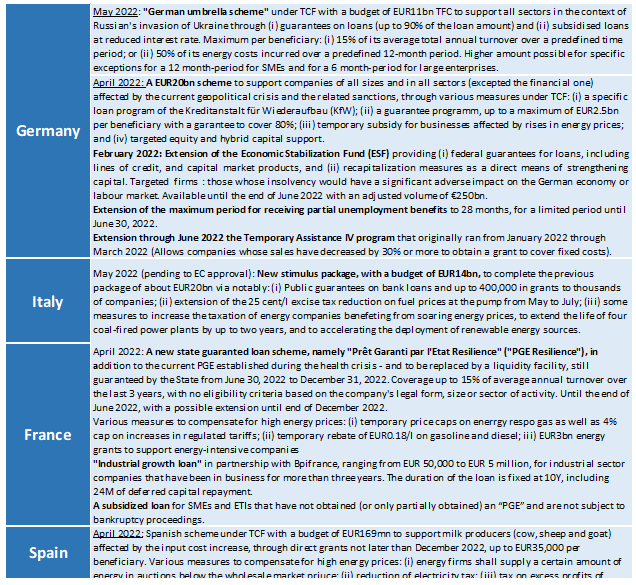
- However, pockets of fragilities and uncertainty over how long the current shocks could last have already sparked the return of temporary support measures in some countries. First, working capital requirements increased in 2021 particularly in Asia (+2 days), Central and Eastern Europe (+2 days) and Latam (+2 days), and for sectors such as household equipment (+8 days), electronics (+3 days) and machinery equipment (+2 days). Second, non-financial companies in the Eurozone have posted a noticeable deterioration of their debt-to-GDP ratios (+5.2pp compared to +3.5pp for the US). In response, governments in France, Germany and Italy have already extended existing partial unemployment programs and introduced new forms of state-guaranteed loans, with more measures likely the longer this crisis lasts. We expect state support to be more targeted and limited this time around, but it could still delay the full normalization of business insolvencies once again, notably in some European countries.
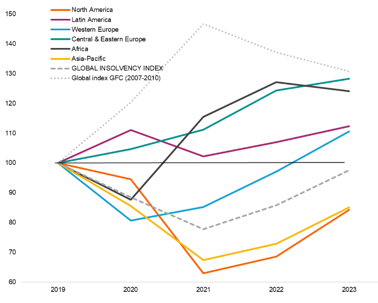
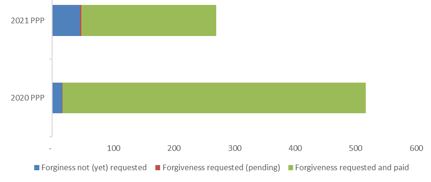
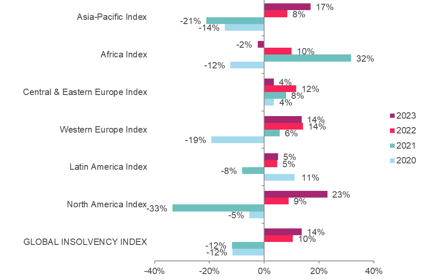
- Overall, after two years of declines, we expect global business insolvencies to rebound by +10% in 2022 and +14% in 2023, approaching their pre-pandemic level. While state support will keep insolvencies artificially low in France (32,510 cases) and Germany (14,600) in 2022, the UK could see a sharp rebound in 2022 (+37% y/y to 22,305 cases). One in three countries will return to pre-pandemic levels in 2022 and one in two countries in 2023. Africa and Central and Eastern Europe will both reach new record highs. In Asia, China should be able to maintain insolvencies in check but other countries could see an increase due to the deterioration of the regional and global environment. In contrast, companies in the US (15,500 cases in 2022) should benefit from the buffers accumulated since the pandemic, helped by the Paycheck Protection Program being massively transformed into subsidies and the recovery in profits.
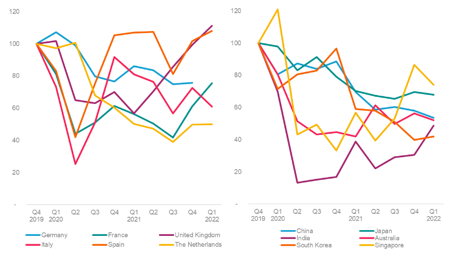
Figure 1: Global and regional insolvency indices, yearly level, base 100 in 2019