Allianz Trade Collection Complexity Ranking 2022

Commercial debt collection: USD4.2trn at risk in the most complex countries

20 June 2022

Executive Summary

  • As central banks around the world tighten monetary policy to cope with surging inflation, financing costs are set to rise for companies, contributing to the return of business insolvencies. In this context, recovering debt could become even more of a challenge. In the third edition of the Allianz Trade Collection Complexity Score and Rating, we analyze local payment practices, court proceedings and insolvency frameworks to identify the countries where it is most difficult to collect debt. This year, our ranking covers 49 countries that represent nearly 90% of global GDP and 85% of global trade.
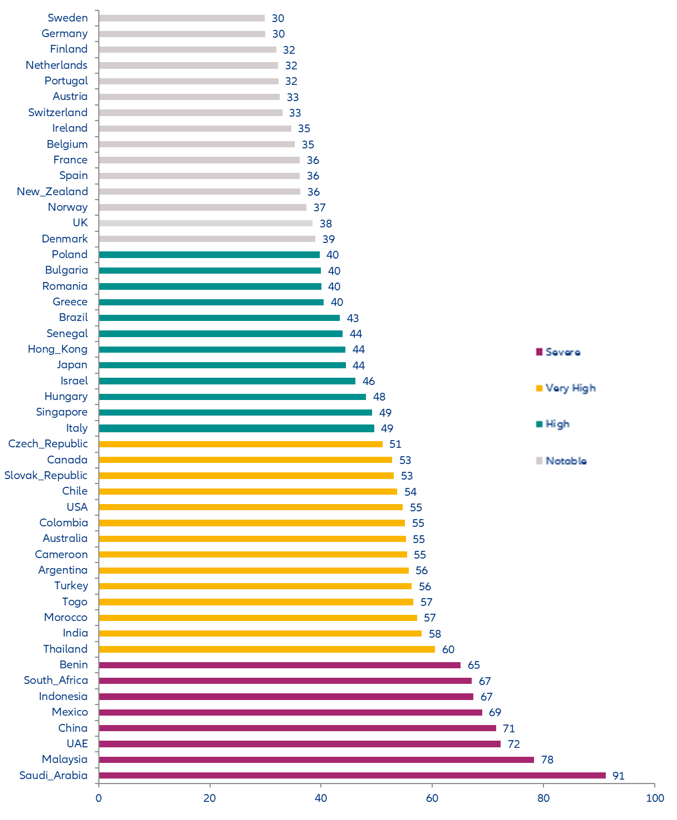
  • Sweden, Germany and Finland are the three best countries to recover international debt in the world, while Saudi Arabia, Malaysia and the United Arab Emirates are still lagging behind when it comes to making it easier for (foreign) companies to recover their dues. International debt collection is almost three times more complex in Saudi Arabia than in Sweden, but the latter is not without complexities in terms of international collection. Globally, collection complexity stands at 49 on our 0-100 scale, which corresponds to a ‘high’ level of complexity out of a four-notch scale: ‘notable’, ‘high’, ‘very high’ and ‘severe’.
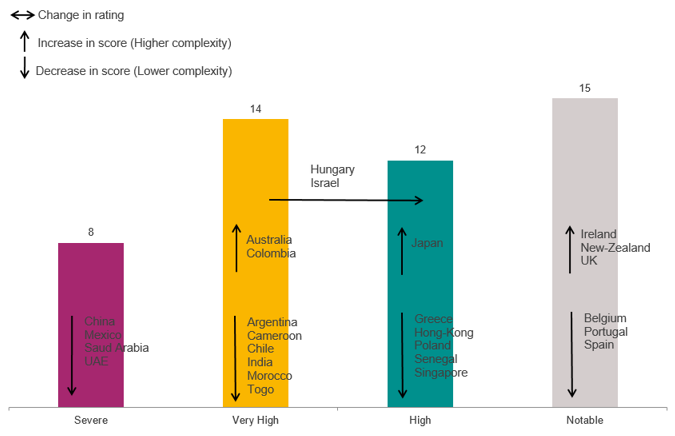
  • In the past four years, 20 out of the 49 countries in our sample have seen their collection complexity score improving, including the most complex countries such as Saudi Arabia and China, in part because the Covid-19 crisis led many to accelerate reforms of insolvency frameworks. However, the changes were large enough to lead an improved rating for only two countries ( Hungary and Israel).At the same time, while we also noticed some improvements in terms of preventive restructuring frameworks in the UK (with the new procedure moratorium), Australia and the EU (Directive 2019/1023), these have not yet reduced collection complexity. Six countries have seen their scores slightly deteriorate ( Australia, Colombia, Japan, Ireland, New Zealand, UK).
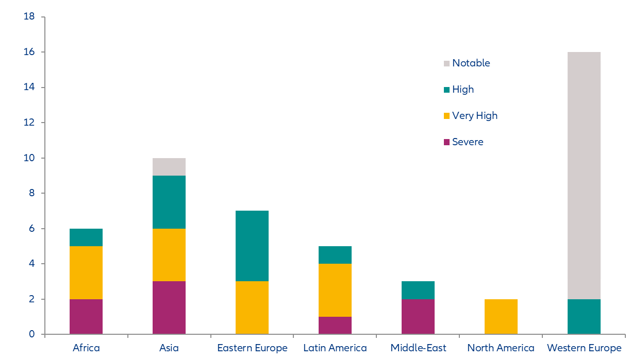
  • Collection complexity has been reducing in emerging markets over time, gradually closing the gap with advanced economies. However, while most advanced economies have a ‘notable’ level of collection complexity, the US and Canada both post a ‘very high’ rating. On average, the Middle East, Asia and Africa are the top three most complex regions.
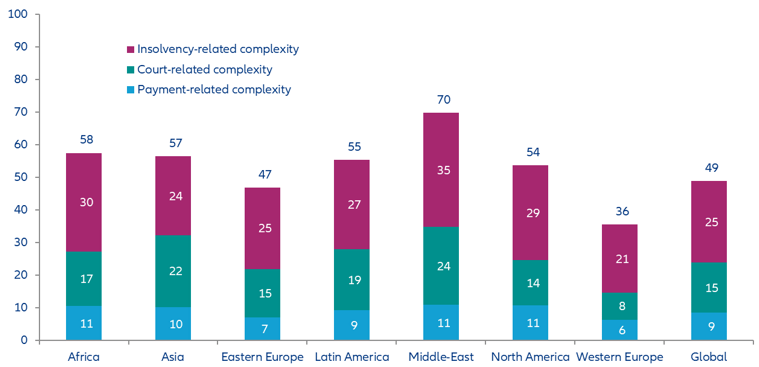
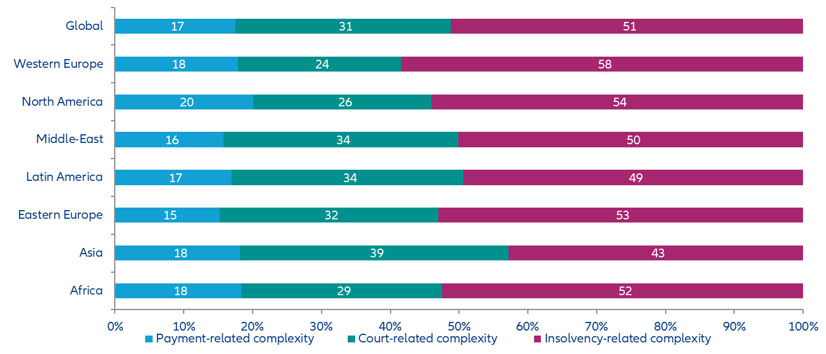
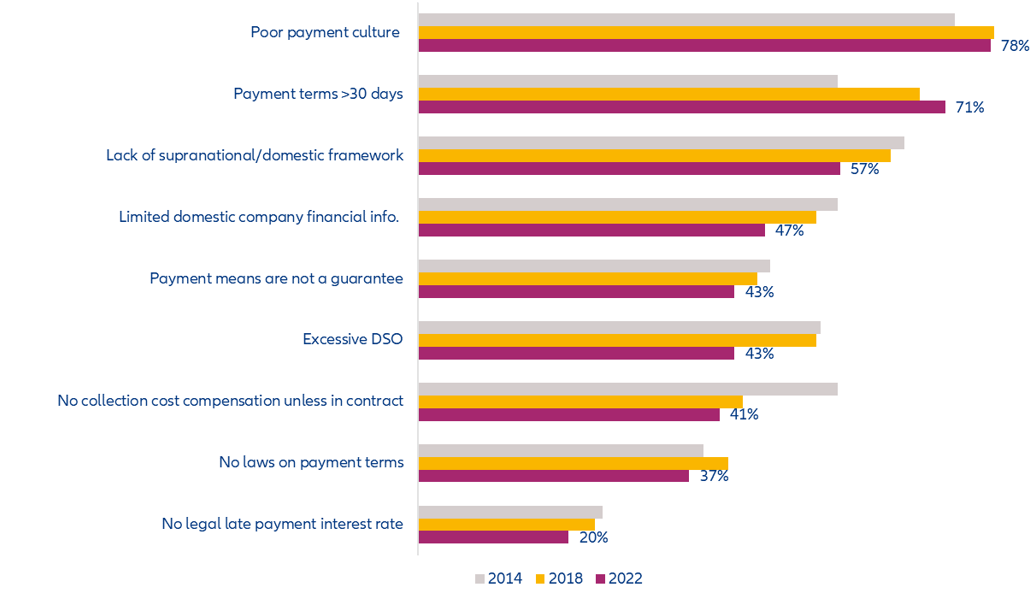
  • The largest economies, most dynamic markets or less vulnerable countries (in terms of country risk) do not necessarily offer a more conducive business environment: Pockets of collection complexity exist in all countries in three key areas: local payment practices (17% of the collection complexity), local court proceedings (31%) and local insolvency proceedings (51%). Local payment practices, in particular, stand out in the Middle East but they are a source of complexity in most countries. Court-related complexities are slightly less frequent, notably within Western Europe and North America, but each occurrence is definitely more challenging. However, insolvency-related complexities are the by far the most predominant, contributing from 43% (Asia) to 58% (Western Europe) to global collection complexity.
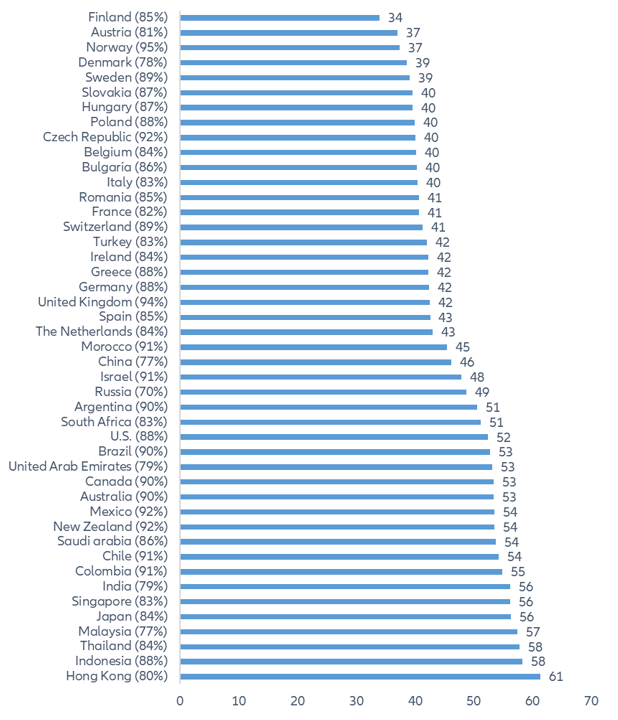
  • Combining countries’ collection complexity scores with their share of trading partners , we can also calculate exporters’ exposure to international debt-collection complexity. Finland, Austria and Norway are leading the list of countries that are least exposed. On the other hand, Asia stands out with seven of the most exposed countries due to their higher share of international trade with countries where debt collection is more complex: Hong Kong, Indonesia, Thailand, Malaysia, Japan, Singapore and India.
  • Overall, we estimate that trade receivables in the countries with a ‘severe’ level of collection complexity exceeds USD4.2trn, compared to USD3.5trn for countries with a ‘very high’ level of collection complexity and USD1.9trn and USD2.4trn for countries with ‘high’ and ‘notable’ collection complexity, respectively.

Figure 1: Collection Complexity score and ratings

Figure 1: Collection Complexity score and ratings
Source: Allianz Research

Globally, Collection Complexity stands at 49 on our 0-100 scale, which corresponds to a ‘high’ level of complexity. This global average is slightly below the outcome of the 2018 edition (an average of 51 ) and masks a slightly smaller dispersion between the ratings ‘severe’, ‘very high’ and ‘high’. This year’s edition has a smaller share of countries ranked ‘severe’ (16% compared to 30% in 2018) and ‘very high’ (29% compared to 34%), alongside a higher share of countries ranked ‘high’ (24% compared to 18%).

Figure 2: Breakdown of countries by rating and region (in number of countries)

Figure 2: Breakdown of countries by rating and region (in number of countries)
Source: Allianz Research

This year, our ranking shows that it is relatively easier to collect debt in almost three out of 10 countries, most of them located in Western Europe, with the exception of New Zealand. Interestingly, despite the various changes in insolvency frameworks that occurred since the Covid-19 outbreak, most of the countries in this ‘notable’ category (9 out of 15) saw their collection complexity scores staying stable compared to 2018. In practice, the various changes differ from one country to the other in their nature or duration, creating new conditions that foreign companies must adapt to. This has maintained the global complexity in collecting internationally in the short term even though the changes were designed to reduce the number of liquidations.
Portugal, Belgium and Spain posted a decrease in their collection complexity scores compared to 2018, while the UK, Ireland and New Zealand recorded a moderated increase. Sweden remains the best in class, ahead of Germany and Finland.

We identify 12 countries with a ‘high’ level of collection complexity, notably in Europe ( Bulgaria, Hungary, Poland and Romania in the East; Greece and Italy in the West) but also in Brazil, Hong Kong, Israel, Japan, Senegal and Singapore). In Africa, Asia, Latin America and even North America, more than 60% of countries are rated either 'very high’ or ‘severe’. Three out of five countries in Latin America report very high collection complexity: Argentina, Colombia and Chile. Eastern Europe has three: Czech Republic, Slovakia and Turkey. The US and Canada both stand in this category, as well as three Asian countries: Australia, India and Thailand. Overall, more than a quarter of our sample comes under the ‘very high’ category of collection complexity (14 countries).
One out of five countries come under the ‘severe’ category, with Saudi Arabia, Malaysia and the United Arab Emirates the countries where it is most difficult to collect debt. Asia records the highest number of countries in this category, despite a small improvement from the 2018 edition, while Africa and the Middle East both feature two countries: South Africa and Benin for the former, Saudi Arabia and the UAE for the latter. Mexico and Russia remains in this category for the third time.

A deeper analysis by region shows that Western Europe presents by far the highest number (14) and share (88%) of countries recording a ‘notable’ level of collection complexity, with only two countries rated in another category ( Greece and Italy – both belonging to the ‘high’ category). However, dealing with debtors who have entered insolvency proceedings is more complex in the UK and the Netherlands than in Finland and Sweden. Similarly, court-related complexities are larger in France and Finland than in Germany and the Netherlands. At the same time, Spain stands out with higher payment-related complexities than the Nordics.

De facto, Germany and Sweden have opposite sources of complexity (insolvency-related for the former, court-related for the latter) despite the fact they have a similar collection complexity score. Similarly, the US and Canada both rank in the 'very high' category, with almost the same score. For both countries, this outcome results primarily from their multi-level systems (e.g. county, state and federal structure) and the lack of efficiency in recovering unsecured debt.

Asia, which is the major actor in international trade, and Africa offer the most diversified picture, with countries in each of the three most complex rating categories (severe, very high and high) but also better performers ( New Zealand for Asia).
In Eastern Europe , countries are divided into the two central categories, with four in the 'high' category ( Bulgaria, Hungary, Poland and Romania) and three in the 'very high' category (Czech Republic, Slovakia and Turkey). In the Middle East, Saudi Arabia and the UAE top the list of most complex countries in the world due to several factors: In Saudi Arabia, procedural delays, high costs and the general uncertainty of local legal action - notably regarding the enforcement of foreign decisions. In the UAE, the complexity of the legal framework and the lack of independence and reliability of courts.

Figure 3: Overview of changes in scores and ratings

Figure 3: Overview of changes in scores and ratings
Source: Allianz Research

To identify how exposed exporters are to international debt-collection complexity, we combine the scores in our ranking with the scores of each country’s trading partners, based on the share of total exports. Interestingly, the Asian countries stand out, with seven of them topping the list of most exposed countries: Hong Kong (level 61), Indonesia (58), Thailand (58), Malaysia (57), Japan (56), Singapore (56) and India (56). At the opposite end of the spectrum, we have Finland (34), Austria (37) and Norway (37) leading the list of countries less exposed to debt-collection complexity due to international trade. The top five European countries record slightly below-average exposure to international debt-collection complexity, with Spain, the UK and Germany more exposed than France and Italy.

Overall, we estimate  that trade receivables in the countries with a ‘severe’ level of collection complexity exceeds USD4.2trn, compared to USD3.5trn for countries with a ‘very high’ level of collection complexity and USD1.9trn and USD2.4trn for countries with ‘high’ and ‘notable’ collection complexity, respectively.

Figure 4: International debt complexity score for export markets*

Figure 4: International debt complexity score for export markets*
(*) the figures in brackets indicate the weight of countries with a collection complexity score in total exports, excluding countries not available in the UNCTAD export matrix for goods and services for 2021.
Source: Allianz Research

From one country to another, international debt collection is never the same and its complexity depends on many different factors. Our score gives a harmonized cross-country comparison by benchmarking local practices through objective indicators relating to the same set of core issues on payment practices, local court proceedings and local judicial proceedings.

Figure 5: Sources of collection complexity by region (contribution to the regional score)

Figure 5: Sources of collection complexity by region
Source: Allianz Research
Figure 6: Sources of collection complexity by region (contribution to the regional score)
Source: Allianz Research

At a global level, our score reveals that the key factor behind how difficult it is to collect debt is by far the local insolvency proceedings, with no outstanding differences by region. On average, this contributes to half of the collection complexity of countries (51% - stable from 2018 edition), ranging from a relatively lower 43% in Asia (43%) to a high 58% in Western Europe. Yet, in absolute terms, insolvency-related complexity is definitely more of a challenge in the Middle East than in Western Europe.

Difficulties in dealing with debtors who have entered insolvency proceedings depend on various factors:

  • Whether the legal framework for insolvency is excessively complex.
  • Whether renegotiation leads to a significant debt write-off.
  • Whether restructuration mechanisms are used and out-of-court negotiation proceedings exist.
  • Whether retention of title (ROT) would grant priority during liquidation proceedings.
  • Whether unsecured creditors would have a chance to recover any part of their debt after liquidation.

The most frequent issue, mentioned for almost all countries, is the low probability to recover a debt as an unsecured creditor in practice when the liquidation proceedings have commenced.

Figure 7: Insolvency-related complexity – Top difficulties for collection (number of countries in %)

Figure 7: Insolvency-related complexity – Top difficulties for collection (number of countries in %)
Source: Allianz Research

Court-related issues represent the second source of complexity at the global level (31% on average – stable from 2018 edition) as well as for all the countries individually, ranging from a low 24% in Western Europe to a high 34% in the Middle East and 39% in Asia. Interestingly, these issues are the key additional factor of complexity for the countries in the ‘very high’ and ‘severe’ categories. Court-related issues identify how difficult it is to deal with domestic courts by assessing whether the judiciary system is understandable/transparent, whether fast-track proceedings are available, whether ownership protection clauses (such as ROT) are admissible, whether ADR (Alternative Dispute Resolution methods) is an effective way to avoid courts, whether foreign forums/judgements are available/enforceable, etc. Despite a slight improvement since 2018 edition, one of the most frequent issues remains the lack of regional frameworks offering harmonized fast-track proceedings, ex aequo with the lack of flexibility in relation to reciprocity when enforcing a foreign decision, which has not improved since the previous edition. Both issues appear in three out of five countries.

Two other issues are also more visible in an increasing number of countries since our first edition: the difficulty to enforce domestic judgments and the restrictiveness of appeal proceedings.

Figure 8: Court proceedings-related complexity
Top difficulties for collection (number of countries in %)

Figure 8: Court proceedings-related complexity Top difficulties for collection (number of countries in %)
Source: Allianz Research

The local payment context and practices are of much less importance in relative terms, compared to court- and insolvency-related difficulties. On average, they contribute to 17% of the overall complexity globally (down from 18% in our 2018 Edition), ranging from a low 15% in Eastern Europe to a high 20% in Africa. Yet, they are often mentioned as a factor of difficulty, in particular in the Middle East, Africa and Asia, with the most complex practices occurring in China, South Africa, Saudi Arabia, India and Indonesia. To this regard, the two most frequent issues are the low level of payment culture, in almost eight out of 10 countries, and the payment terms, in seven out of 10 countries.

Figure 9: Payment-related complexity
Top difficulties for collection (number of countries in %)

Figure 9: Payment-related complexity Top difficulties for collection (number of countries in %)
Source: Allianz Research
The Allianz Trade Collection Complexity Score provides a simple assessment of how easy it is to collect debt around the world. The 2022 edition covers 49 countries that represent nearly 90% of global GDP and 85% of global trade.