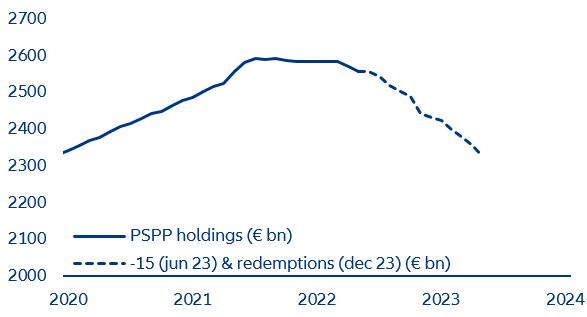
In focus – Sector vulnerability to rising financing costs

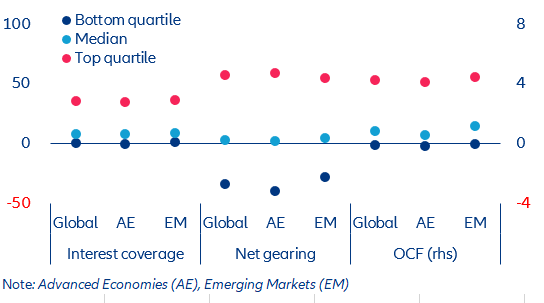
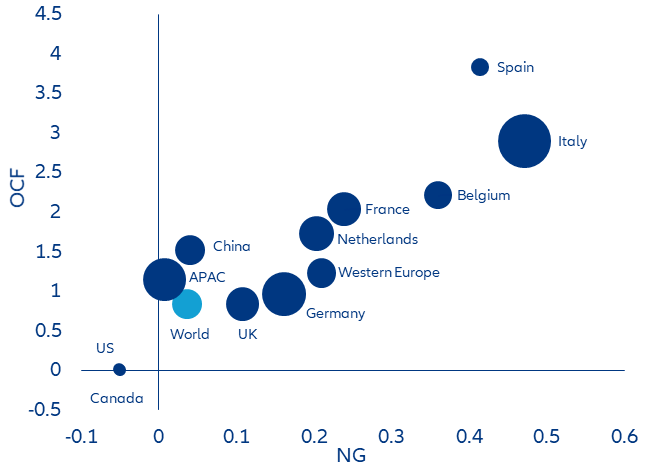
  • With a debt/EBITDA ratio of 3.8x on average, US firms are more leveraged than European ones (3.3x). But Europe has a higher proportion of total debt maturing in one year (20% vs 14% for the US). Looking at the operating cash flow coefficient, net gearing and interest coverage, we find that corporates in Italy, Spain, Belgium, France and the Netherlands seem most exposed to a liquidity squeeze.
  • No rest for the leveraged, notably for those with high debt redemptions in the short run. Companies in advanced economies appear to be safer than those in emerging markets when it comes to their level of indebtedness (net gearing below 2.3% for half of the firms in advanced economies vs 4.9% in emerging markets) and ability to meet financial commitments.
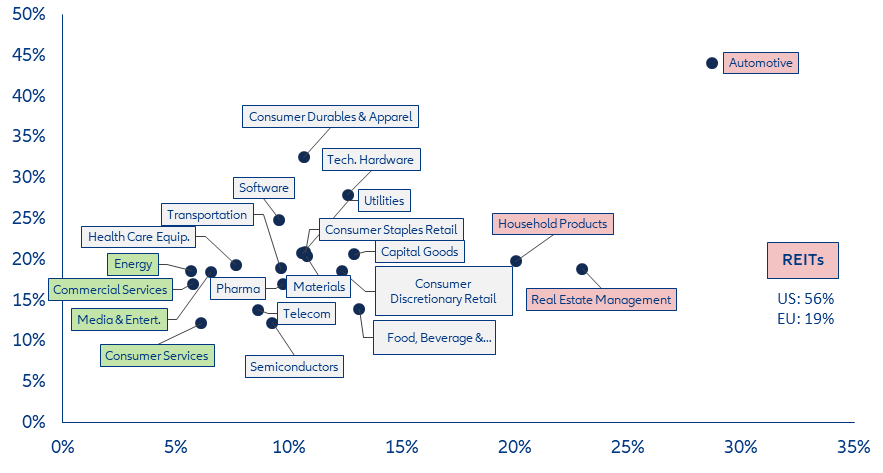
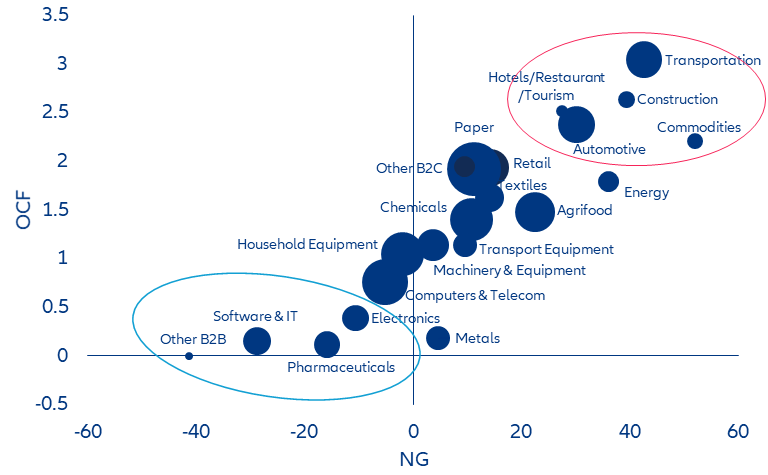
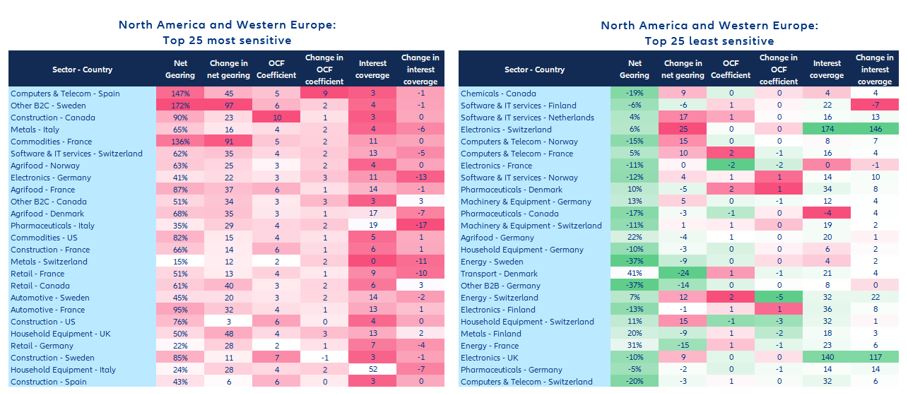
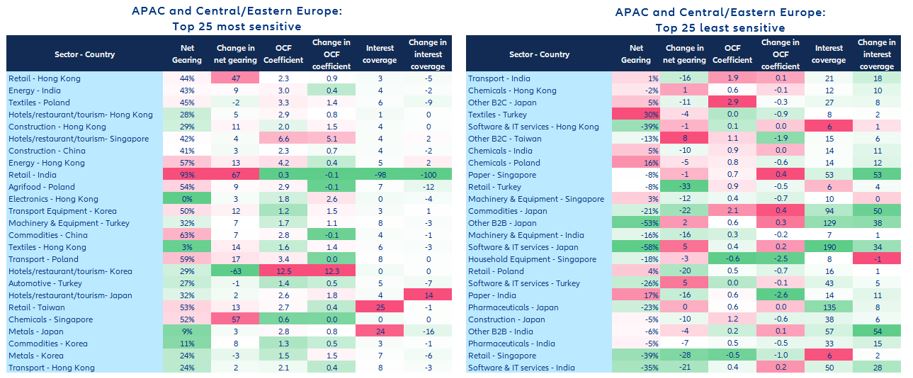
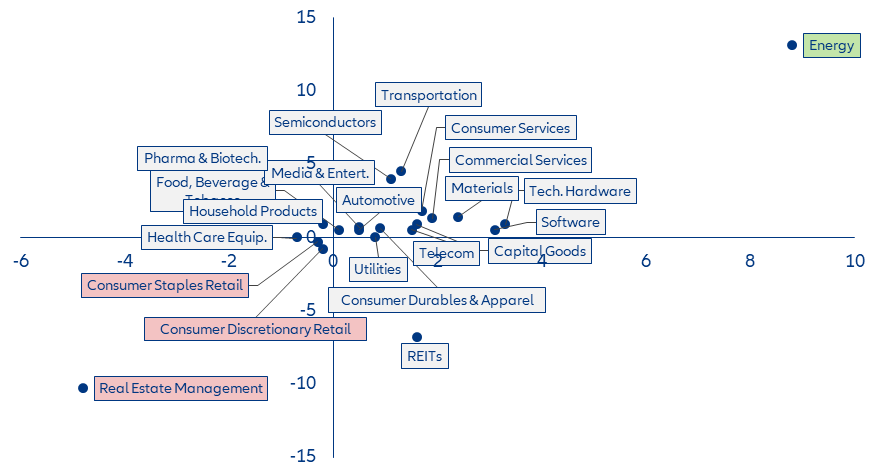
  • Five sectors stand out as the most exposed to financing stress: transportation, construction, hospitality, commodities and automotive. Construction and retail top the watch list in both North America and Western Europe. Real estate is the sector most exposed to debt due within one year, followed by automotive, which however has an average current ratio of 1.2x. In Asia-Pacific and Central/Eastern Europe, metals, energy and, to a lesser extent, hospitality and retail are more of a concern.
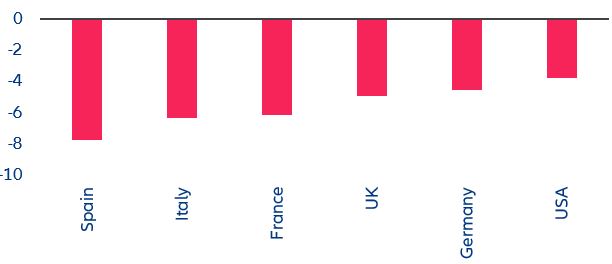
  • Things could get worse as the profit squeeze should become more visible in autumn when we expect the full transmission of interest rates. Overall, we calculate that the equivalent of the full rise in financing costs since 2022 stands above -7pps of the gross value added in Spain, more than -6pps in Italy and France, -4.5pps in Germany and close to -4pps in the US (ceteris paribus). Retail is most affected sector in terms of profitability as it has the lowest operating margins (7.5% for discretionary and 4.2% for staples vs an all-industries average of 15.9%). Stubborn inflation and the intensification of the price war between retailers should exacerbate further the deterioration already observed in 2022.
Inflation is cooling down in the largest Eurozone economies. The latest data show that inflation pressure is easing in the Eurozone, especially in energy and food. German headline inflation in May fell for the third month in a row to 6.3% y/y (-1.3pp lower than in April), with energy prices declining by -4.2pps to 2.6% y/y. While food inflation is still very high at 14.9% y/y, it decreased -2.3pps from April. Meanwhile, France’s national CPI came out much lower than expected at +5.1% y/y. While energy inflation was expected to ease (to +2% y/y), core prices surprised on the downside, increasing by +0.3% m/m in sequential seasonally adjusted terms, after averaging +0.8% per month over the three prior months. In Italy, the declining trend resumed in May, with the headline measure falling to 7.6% (from 8.2% in April). Encouragingly, core inflation posted the second consecutive marginal decline (to 6.1% y/y from 6.2%). Finally, in Spain, inflation also resumed its downward trend, with headline inflation falling from 4.1% in April to 3.2% in May, below market expectations (3.4%). Core inflation (which excludes the more volatile food and energy prices) declined for the third consecutive month, falling to 6.1% from 6.6% in April.
Figure 1: German CPI inflation and import prices (y/y, %)
Sources: Refinitiv Datatsream, Allianz Research

But Italy and Spain may be stuck with sticky services inflation for longer. Despite household savings dwindling to below pre-pandemic levels in Italy, private consumption remains quite resilient (up +0.5% in Q1), which will complicate the ECB mission to tame inflation. As a result, we expect prices of services to ease at a more gradual pace than those of goods. Similarly, inflation in the services sector remains high in Spain (above 4%) and there is little scope for price cooling in the short to medium term due to the strong recovery in tourism, in addition to upcoming wage hikes (we estimate a wage increase of +4.6% in 2023 and +4.1% in 2024).

Energy inflation will continue to be negative until year-end, even if base effects will be lower. We expect oil prices to remain -18% and -15% below 2022 levels compared to -20% currently respectively. This coupled with falling import prices, should support German CPI inflation to come down to around 4% by the end of 2023 (down from our previous forecast of slightly below 5%). Similarly, in France, price expectations from the latest business surveys and much lower energy prices point to inflation falling to around +4% by the autumn (vs our previous expectations of above +5%). In Spain, inflation is expected to fall to around +3.5% on average in 2023, and around +3% by year-end. In Italy, we expect inflation to average +5.9% in 2023 but to fall below +4% by year-end.

Figure 2: French CPI inflation and businesses’ selling price expectations (average retail, services, industry)
Sources: Refinitiv Datastream, European Commission ESI survey, Allianz Research.
As the ECB pulls the plug on government debt purchases, international investors are taking its place in Spain but not in Italy. Since the beginning of the Covid 19 pandemic, the ECB has played a major funding role for Italy and Spain, acting as a source of permanent demand for their respective mid- and long-term bonds. From a net perspective, the ECB bought an average EUR10bn worth of Italian bonds and around EUR6bn of Spanish government bonds on a monthly basis. Now, with the ECB stepping back from quantitative easing, international investors are taking its place, mostly piling up in the mid- and long-end of the Spanish sovereign curve, absorbing the post-ECB excess liquidity. But they continue to refrain from taking long positions in Italian sovereign debt. Interestingly, in the case of Italy, it is the Italian domestic private sector that is keeping spreads in check by piling up record amounts of Italian sovereign exposure (Figures 3 and 4).
Figure 3: Italy government debt monthly changes by ownership (in EUR bn)

Sources: Banca d’Italia, Refinitiv Datastream, Allianz Research

Note – MFI: Monetary Financial Institution

Figure 4: Spain government debt monthly changes by ownership (in EUR bn)

Sources: Banco de España, Refinitiv Datastream, Allianz Research

Note - RoW: Rest of the World / NFC: Non-Financial Corporate

The remaining supply of Italian and Spanish sovereign bonds will still be sizeable in 2023. As of today, considering the respective budget plans for 2023 and the year-to-date issuance, the Italian government will still have to issue around EUR210bn worth of bonds until the end of the year, while Spain will have to issue around EUR125bn in gross terms. But at the current year-to-date pace (EUR30bn for Italy until February and EUR37bn for Spain until March), the appetite for Italian and Spanish bonds seems to exceed the planned issuance for 2023, as also shown by the relatively high and stable bid to cover ratios.

We do not expect major widening waves for the Italian or Spanish sovereign markets in 2023-2024, but the immediate future remains filled with uncertainty. The ECB’s sovereign debt holdings are expected to passively contract from EUR2.56trn today to EUR2.33trn in April 2024 (Figure 5). However, most of this has already been priced in and investors still believe in the ECB’s permanent put protection (in the form of the Transmission Protection Instrument (TPI), for example). Nonetheless, we expect the intrinsic volatility in the long end of both curves to be structurally higher moving forward as a non-negligible source of permanent demand will continue to disappear.

In the case of Italy, the recent structural political uncertainty paired with increasing recessionary risks may lead to short-term volatility in long-term spreads, pushing the 10y BTP spread above 200bps for a short period of time irrespective of the ECBs unwinding path. A similar story can be told for Spain as the call for new elections this summer may lead to periods of high market volatility that may spook international investors, leading to spread-widening periods. In this context, we continue to expect the 10y BTP to end 2023 at 190bps (vs 190bps currently) and the 10y Spanish bono to finish 2023 at 100bps (vs 106bps currently).

 Figure 5: ECB – Public sector purchases programme (EUR bn)
 Figure 5: ECB – Public sector purchases programme (EUR bn)

Sources: ECB, Refinitiv Datastream, Allianz Research

Note: We exclude the PEPP as there is no active unwinding of the programme until the end of 2024

In our updated Public Debt Sustainability Risk Score (PDSRS) ranking, we find heavyweights such as Brazil, Colombia, Egypt and South Africa among the top 30 emerging and developing markets with the least sustainable public debt. But the devil is in the details. These countries are forecast to post large fiscal deficits in 2023-2024, will face relatively high interest payments and moderate or even negative economic growth amid monetary tightening conditions. Yet, Brazil, Colombia and South Africa should be able to avoid default in the next two years as most of their debt is domestic and they enjoy manageable debt-maturity structures. Moreover, they can leverage a rather diversified lender base and relatively high foreign exchange (FX) reserves so that liquidity should not be an issue in the near future. In contrast, Egypt’s debt metrics have become an increasing cause for concern as the total debt stock (currently around 91% of GDP) has significantly risen post-Covid-19 and the fiscal deficit is projected at -7% of GDP in 2023. Moreover, the country’s interest payments account for a hefty 53% of revenues (the third highest in our country sample), with an effective interest rate reaching 14% and the highest differential if we compare the interest rate on public debt and nominal GDP growth in 2023-2024 (+26pps). Furthermore, Egypt’s gross external-financing requirements are almost twice as high as its official FX reserves, reflecting liquidity problems on top of debt distress.
Figure 6: Public Debt Sustainability Risk Score (PDSRS)
Sources: various, Allianz Research
Africa remains the continent with the most stressed sovereigns, which explains in part why energy and technology transition-related investment projects centered in the area remain in a state of constant stop-and-go. Many nations, in addition to Ghana, Mozambique, Zambia and Egypt, are still facing liquidity concerns (Malawi, Kenya, Uganda, Tunisia, Rwanda, Senegal, Mauritius and Angola, in order of comparison in classification). While negotiations with the Fund in North Africa are stalling, with the positive exception of Morocco, glimmers of hope have emerged in recent weeks for several Sub-Saharan African countries, thanks to an acceleration in IMF deals. Ghana saw the first tranche of funding after the selective default in December 2022. Kenya gained access to about USD1bn of additional IMF funding to tap liquidity needs and look with less concern to June 2024, when the USD2bn Eurobond that the government has long sought to refinance reaches maturity. Finally, Ivory Coast also received support to limit debt exposure in the midst of a major economic cycle that is expected to culminate with the Africa Cup in early 2024 and the commissioning of mineral production sites.
Figure 7: Funding drawn as a % of the amount agreed on current IMF programs

Note: Morocco agreed on a Flexible Credit Line of USD5bn in April, which is not shown in the chart since the amount is available without conditionality.

Sources: IMF, Allianz Research

El Salvador and Costa Rica are additional Latin American countries on the debt-sustainability watch list. Both have a worrisome debt trajectory, relatively high interest obligations and low FX reserves. However, they have no debt owed to China and near-term maturing public debt is not an immediate concern. Elsewhere in the region, Suriname defaulted in 2020 but its debt restructuring is still incomplete, not least because debt owed to China has posed hurdles.

Pakistan, Laos and Bangladesh are the Asian countries most at risk of following in the footsteps of Sri Lanka, which defaulted in 2022. Pakistan in particular is on the brink of sovereign default, facing huge interest payments (estimated at 57% of revenues in 2023-2024, the second highest after Sri Lanka in our country sample) and very low FX reserves. Yet, political instability and policy standstill has put on hold financial support from the IMF and GCC states for several months now. Laos’s external debt stock and forthcoming interest payments are very high, with 86% of public debt being FX-denominated and China being the largest single creditor. Bangladesh’s debt stock is moderate but 75% is FX-denominated and interest payments account for 20% of fiscal revenues.

In Emerging Europe, Russia, Ukraine and Belarus have defaulted over the past year, but there are no other countries seriously at risk of failing in the next two years. The three defaults have resulted from Russia’s war in Ukraine, with Western sanctions affecting Russia and Belarus (which supports Russia logistically).

In the Middle East, Lebanon, Bahrain and Jordan remain in the spotlight. Lebanon has been in default since 2020. Bahrain already ran out of fiscal policy buffers in 2017, but has since been kept afloat, thanks to financial support from Saudi Arabia and the UAE, which we expect to continue. Jordan’s public debt trajectory has deteriorated for more than a decade, although financial support from the IMF and Gulf countries should help it to avoid a debt default in the first two years of marriage of Jordan’s crown prince to a Saudi princess.

When it comes to redressing macroeconomic imbalances there is no one-size-fits-all recipe, policy outcomes can last longer than the issues they are meant to fix. The challenges the heavyweights are facing, for example, have more to do with durable and inclusive growth than public debt per se. However, the success of the IMF's support programs in being able to direct resources where they are most needed and the more active role that lenders as a whole have in the current environment will be key variables in enhancing fiscal sustainability of the most vulnerable countries. However, a lack of willingness to reform can eventually impede the signing of an agreement with the Fund (examples: Lebanon and Tunisia) or bring an existing support program off track (example: Pakistan). In such cases a sovereign default appears ultimately inevitable.

There will be no rest for the leveraged, notably for those with high debt redemptions in the short run, notably real estate, household equipment and automotive. In a context of rising interest rates and slowing economic activity, demand for credit has plummeted to the lowest level since 2008. New loans fell by more than -30% 3M/3M in the US and by -9% in Spain and -6% in France. Amid weaker earnings, both developments (i.e. tighter financing conditions and diminishing availability of credit) are raising the vulnerability of firms most exposed, i.e. those that are already struggling to service their debt or hold more debt. The situation is especially challenging for those with a higher share of debt at variable rates or debt maturing in the very short term.

Besides real estate, automotive is the sector most exposed to short-term debt maturities (Figure 8), with 29% and 44% of total debt maturing within the next 12 months in the US and Europe, respectively. However, most of the sector’s debt comes from their financial services divisions. In fact, Original Equipment Manufacturers’ consolidated balance sheets are liquid enough as current ratios average around 1.2x in both geographies. Also, when comparing to other sectors, automotive is well positioned in terms of interest coverage, with an EBITDA/Interest ratio of 4.9x in the US and of 8.6x in Europe (vs. the worldwide average of 6.9x for this sector).

Figure 8: Percentage of total debt with maturity within one year, US (x-axis) vs Europe (y-axis)
Sources: Bloomberg, Allianz Research

Corporates in Italy, Spain, Belgium, France and the Netherlands seem most exposed to a liquidity squeeze. We look at the fundamentals of a panel of 21,000 firms in advanced economies (AEs) and emerging markets (EMs), addressing the indebtedness question by examining the net gearing (NG), the funding costs issue by analyzing the interest coverage ratio (IC) and the ability to meet debt commitments by checking the operating cash-flow coefficient (OCF). At the aggregated level, based on 2022 financials of non-financial firms, advanced economies appear to be safer than emerging markets when it comes to their respective median level of indebtedness (net gearing below 2.3% for half of the firms in AEs versus 4.9% in EMs). This is also the case for the median ability to meet financial commitments (operating cash flow coefficient at 0.6 years and 1.2 years for half of the firms, respectively), but the gap is smaller in terms of interest expense coverage.

Advanced economies stand out with a larger dispersion in terms of net gearing while it is more balanced between interest coverage and operating cash-flow. This is the result of the high number of firms with significant cash accumulation. De facto, in all countries except Italy, Spain and Portugal, at least 25% of firms have cash accumulation exceeding financial debts, pushing the net gearing (ratio) into negative territory. At the global level, this is the case for 45% of our sample (i.e. 9,400 firms), with China (47%), the US (48%) and Japan (54%) leading. They are well ahead of European countries, where the figure stands below 40% (UK 38%, Germany 37% and France 34%) and sometimes even less (below 25% for Spain, Italy and Belgium). Yet, at the other end of the spectrum, it is worth noting that 25% of firms are recording a net gearing ratio above 58% at the global level, with a significantly higher net gearing threshold for the US (73%), Germany (70%), France (77%), Italy (92%) and Spain (119%).

Figure 9: Interest coverage, net gearing and operating cash-flow coefficient, dispersion of non-financial firms by quartile, 2022 financials
Sources: Refinitiv Eikon (as of May 28, 2023), Allianz Research
For interest coverage and operating cash-flow coefficient issues, the dispersion appears (much) more limited than for net gearing and shows limited spread between advanced economies and emerging markets. Advanced economies combined look slightly more exposed in terms of the interest coverage ratio, with a lower ratio for both the worst and top performing firms (0.1 year and 34.7 years for the first quartile and fourth quartile, respectively) due notably to the weaker distribution profile for the US, Canada, Australia, Sweden, Norway, Spain, Belgium and the Netherlands. At the same time, advanced economies combined appear slightly less exposed in terms of the operating cash flow coefficient, with a lower coefficient for both the top and worst performing firms (-0.1 year and 4.1 years for the first and fourth quartile, respectively), with almost the same list of countries contributing this time to a stronger profile ( US, Canada, Australia, the Nordics) – but with Spain, Italy, Belgium, and to a lesser extent France and the Netherlands weighing on the results.
Figure 10: Interest coverage (bubble), net gearing (NG, x-axis) and operating cash-flow coefficient (OFC, y-axis), by region/country, median figure, 2022 financials
Sources: Refinitiv Eikon (as of May 28, 2023), Allianz Research
At the aggregated level and based on 2022 financials, five sectors stand out as the most exposed to financing stress, given their median levels of indebtedness and median ability to meet financial commitments: transportation, construction, hospitality (hotels, restaurant, tourism), commodities and automotive. In the transportation sector, half of the firms record a net gearing ratio exceeding 43% and an operating cash-flow coefficient above three years. For construction, this is 39% and three years, respectively. Those five sectors are also registering the highest levels in net gearing ratios and operating cash-flow coefficients for the worst performing firms. Yet, the difference in the interest-coverage ratio is mitigating the risk to the detriment of construction, hospitality and commodities, and in relative terms to the ‘benefit’ of transportation and automotive – the two latter recording a stronger distribution of firms with a larger interest-coverage ratio. Conversely, the safest sectors are pharmaceuticals, software/IT services and more significantly B2B services when considering the net gearing and operating cash flow coefficient. However, it is worth stressing that the latter is also recording the weaker distribution of firms for interest coverage.
Figure 11: Global sectors, net gearing (X-axis), OCF coefficient (Y-axis) and interest-coverage capacity (bubble)
Sources: Refinitiv Datastream, Allianz Research.

Construction and retail top the watch list in both North America and Western Europe. Looking both at the latest level and trend of the three selected indicators[1] in sectors by country, we find that construction is leading the list, with the highest number of sectors in our top 50 most sensitive (in Canada, France, the US, Sweden, Spain (all in the top 25), followed by Norway, Italy, Germany, Switzerland, Belgium, Denmark, Netherlands, UK and Finland). Retail follows, with France, Canada and Germany in the top 25, but there are still seven additional countries in the top 50 ( Sweden, Italy, the UK, Finland, the US and Switzerland). Automotive players remain more exposed in Europe, notably in Sweden, France and, to a lesser extent, Germany and the US, than in Asia. However, there is some leeway for the European companies as we forecast backlog orders of seven to eight months of production in Europe; car registrations in Europe remain -30% below pre-pandemic levels. On the agri-food side, corporates in Norway, France, Denmark, the Netherlands and Canada are the most fragile. Conversely, IT-related sectors (notably electronics), pharmaceuticals and household equipment are among the least fragile in several countries. Yet we record some key exceptions for the former, in particular computers/telecom in Spain, software/IT services in Switzerland, electronics in Germany – all three in our top 25 most sensitive ranking. The less favorable global context, as evidenced by the weaker semiconductor sales, the short-lived computer revival and the stalling smartphone market, is exacerbating competition.

Metals, energy and, to a lesser extent, hospitality and retail, are more of a concern in Asia-Pacific and Central/Eastern Europe. For metals, the concern is broad based among the key countries of Asia, with Japan, Korea, China, Taiwan and Singapore all ranked in the top 50 most sensitive sectors of the regional sample. On the energy side, fragile corporates are mostly located in India and Hong Kong, ahead of China and South Korea. Hotels/restaurant/tourism firms are a concern more for Hong Kong and Singapore, but South Korea and Japan are far from immune and appear in our top 25 most sensitive. On top of retail (Hong Kong, India and Taiwan notably), textiles in Poland, as well as construction in China and Hong Kong, will require close monitoring. At the other end of the spectrum, pharmaceuticals and software/IT services belong to the least fragile sectors in several countries.

Figure 12: North America and Western Europe: Top 25 most (left) and least (right) sensitive
Sources: Refinitiv Eikon (as of May 28, 2023), Allianz Research
Figure 13: Asia-Pacific and Central-Eastern Europe: Top 25 most (left) and least (right) sensitive
Sources: Refinitiv Eikon (as of May 28, 2023), Allianz Research
The profit squeeze should become more visible in the fall, when we expect to see the full transmission of rising interest rates. Amid one of the most rapid tightening monetary policy cycles in history, liquidity strains are increasingly visible as credit conditions worsen rapidly in both the US and Europe. Bank loan interest rates have increased more rapidly in the US (from a low of 3.25% to 8% in April 2023) compared to the Eurozone: +200bps in France to 3.5%, +230bps to 4.2% in Germany, +250bps to 4.2% in Italy and +260bps to 4.6% in Spain, as of March 2023. The rise in interest rates is adding pressure to profitability. We calculate that the equivalent of the full rise in financing costs since 2022 stands above -7pps of the gross value added in Spain, more than -6pps in Italy and France, -4.5pps in Germany and close to -4pps in the US (ceteris paribus).
Figure 14: Impact on margins from rising interest rates, pp of gross operating surplus
Sources: Refinitiv Datastream, Allianz Research.
Retail has historically been the least profitable sector and market conditions will keep it that way. The retail sector has been the least profitable of all sectors, with a 10-years historical average operating margin rate of 4.2% for staple retail and 7.5% for discretionary retail (vs. the global all-industries average of 15.9%).  And there is no sign of improvement: On the one hand, consumption patterns have shifted, with consumers preferring to spend on experiences instead of things. On the other hand, the recent decline in consumer purchasing power has triggered a strong price competition between retailers, which in turn has led to a further deterioration of the sector's margins. Figure 15 shows that besides real estate, staple and discretionary retail are the sectors that have suffered the most deterioration in profitability in recent years. Europe in particular is set to register the highest margin deterioration on discretionary retail as its average operating margin is expected to fall to 5.2% in 2023 vs a historical margin rate of 6.0%.
Figure 15: Improvement (or deterioration) of operating margins by sector, US (x-axis) vs Europe (y-axis)
Sources: Bloomberg (as of 31 May 2023), Allianz Research

Ludovic Subran

Allianz SE

Maxime Darmet

Allianz Trade

Roberta Fortes

Allianz Trade

Jordi Basco-Carrera

Allianz SE

Jasmin Gröschl

Allianz SE

Maria Latorre

Allianz Trade

Maxime Lemerle 

Allianz Trade

Maddalena Martini

Allianz SE

Manfred Stamer

Allianz Trade

Luca Moneta

Allianz Trade