Executive summary

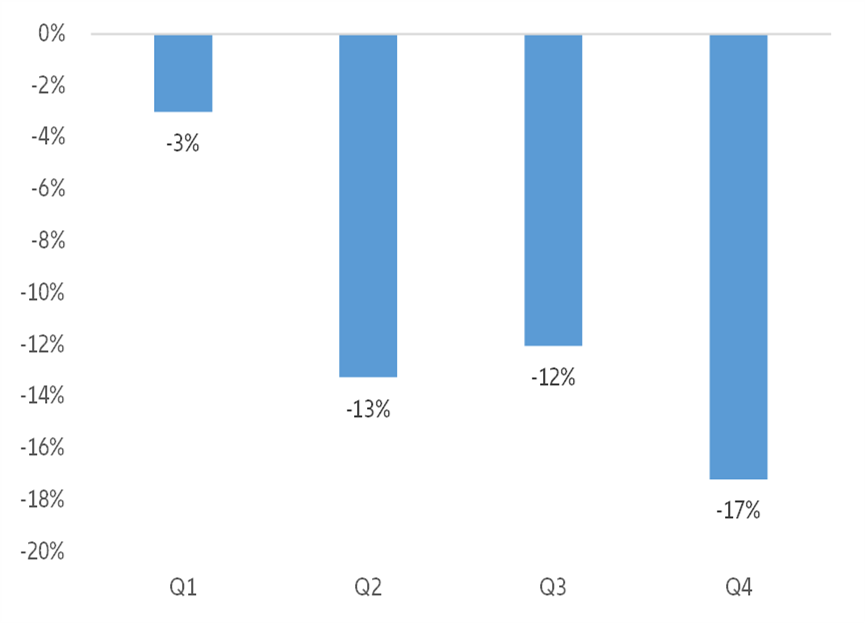
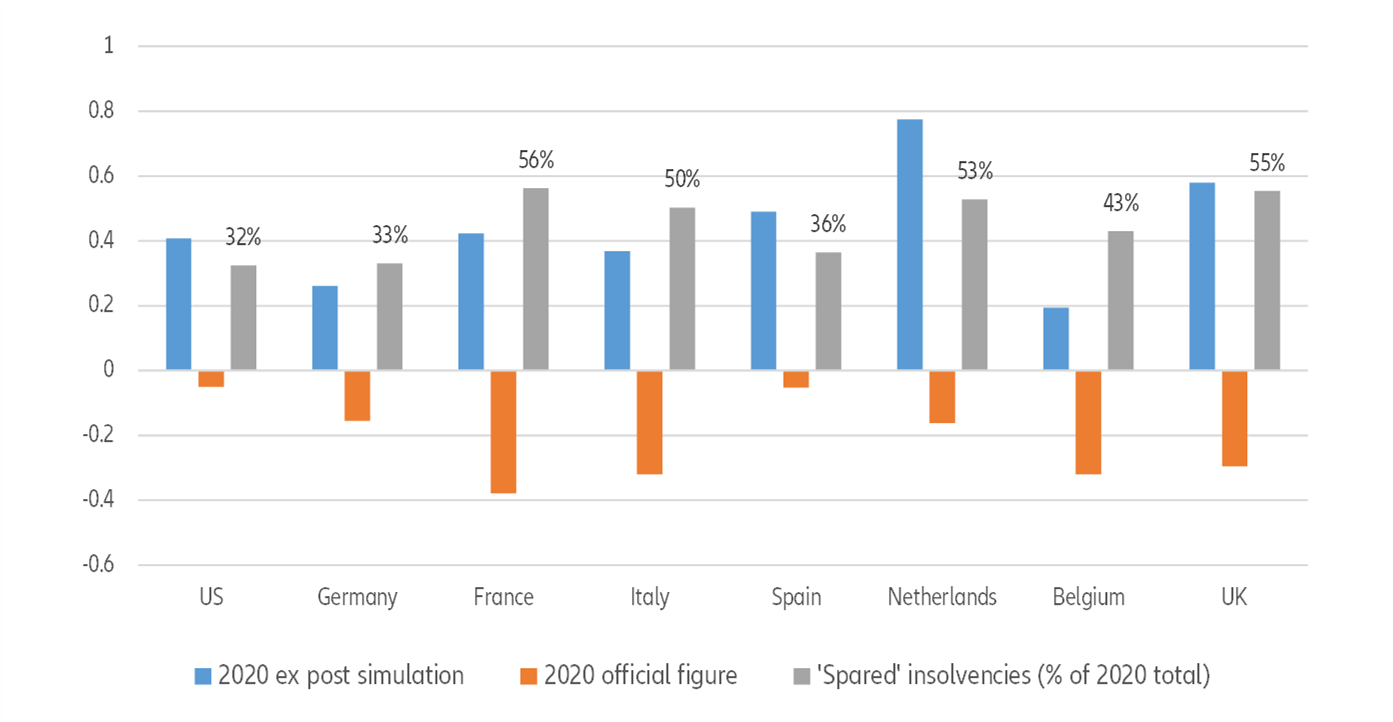
  • Massive state interventions helped prevent one out of two insolvencies in Western Europe and one out of three in the US. Looking at the historical sensitivity of insolvencies to macroeconomic trends , we estimate ceteris paribus that the global economic shock could have resulted in a +40% surge in worldwide insolvencies in 2020. Instead, 2020 ended with a -12% decrease in insolvencies, meaning that the massive state support and further extensions of ‘whatever it takes policies’ prevented more than 35% of insolvencies globally, at least temporarily.
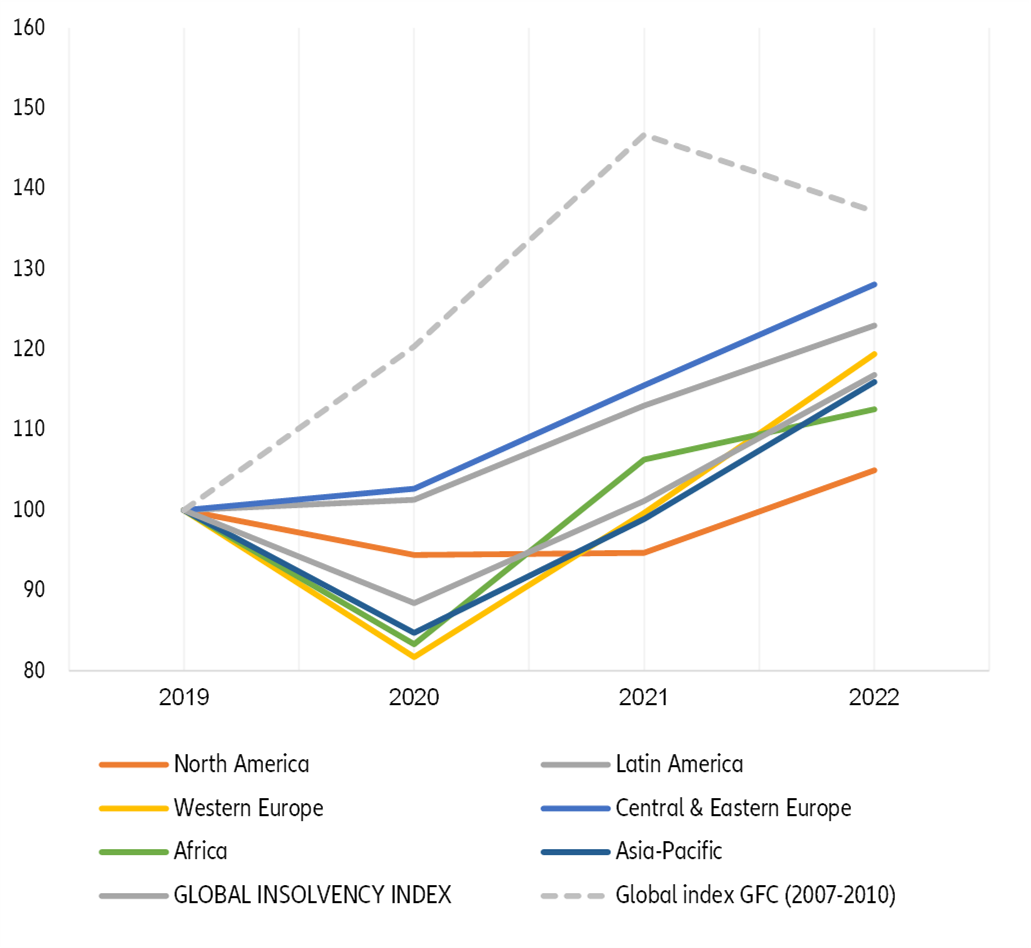
  • Normalization from this paradoxical and artificial low has started and should gain traction later this year. Our Global Insolvency Index is forecast to rise by +14% y/y in 2021, and accelerate by +16% y/y in 2022. Significant increases due to base effects and inherent risks of reopening will lead to an increase in insolvencies starting in H2 2021. However, prolonging existing support measures could limit the number of insolvencies in the short term, raising the risk of more insolvencies in the medium and long term. The comeback of insolvencies will be both asymmetric, due to the multi-speed economic recovery, and gradual, due to a delicate but pragmatic phasing-out of support measures. We expect fine-tuned withdrawals to manage the pressure on companies’ liquidity and solvability. While business insolvencies are likely to exceed pre Covid-19 levels in (almost) all countries (by 17% on average), they will remain below levels seen after the 2008 Financial Crisis in advanced economies.
  • The US will see low-for-longer insolvencies in both 2021 and 2022, with 21,600 and 23,860 cases, respectively,  compared to 23,900 on average over the 2014-2019 period. This is due mainly to the combination of the Paycheck Protection Program (PPP) and the major boost expected from President Biden’s stimulus package.
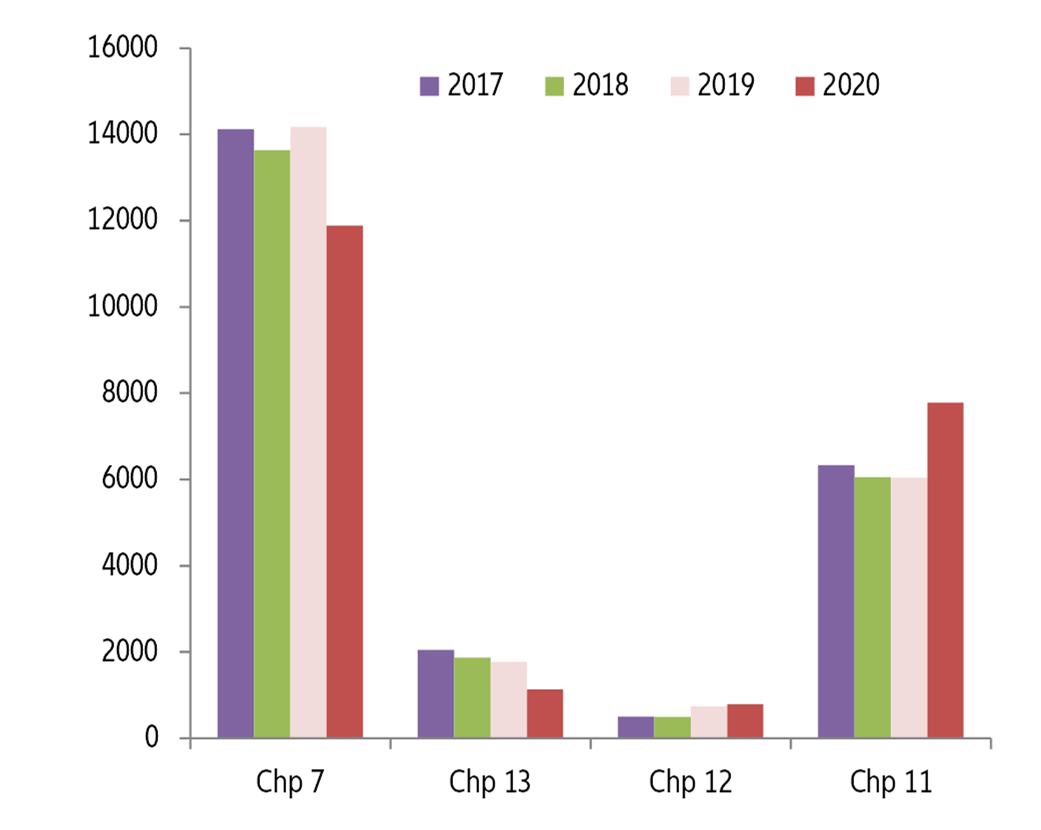
  • Europe: United in Insolvency Diversity. We have countries that will post the largest excess of insolvencies by 2022 compared to 2019, notably in Southern Europe due to a higher share of sectors sensitive to Covid-19 restrictions (5,750 insolvencies in Spain in 2022, compared to 4,162 in 2019; 13,000 insolvencies in Italy compared to 11,106 in 2019), and countries that will see the bulk of insolvencies materializing in 2022 and beyond due to the implementation and/or extension of the largest support packages (56,000 annual cases in France in 2022, 23,500 in the UK 23,500 and 19,600 in Germany). 

Figure 1: Euler Hermes Global Insolvency Index and regional indices, yearly level, base 100 in 2019 

Figure 1: Euler Hermes Global Insolvency Index and regional indices, yearly level, base 100 in 2019
Sources: Euler Hermes, Allianz Research. 
Figure 2: Euler Hermes insolvency indices by region – contribution to the yearly change in Global Insolvency Index
Sources: Euler Hermes, Allianz Research. 

The economic shock caused by the Covid-19 crisis in 2020, with global GDP and trade down by –3.6% y/y and –8.1% y/y, respectively, in real terms, did not translate into the insolvency wave mechanically expected from the usual – and negative – relationship between insolvencies and economic activity. Our Global Insolvency Index   not only ended 2020 with a -12% y/y drop, but remained steady and broad-based all along the year. Our headline indicator posted double-digit drops every quarter, from -13% y/y in Q2 2020 to -17% in Q4 2020 (see Figure 3). Thirty-five out of the 44 countries of our sample (80%) recorded a decline for the full year - the latter reaching double-digit figures in three out of four cases (see statistical appendix).
Exceptions to the global decline occurred mainly in the emerging economies of Central and Eastern Europe (+4% in Bulgaria, +13% in Turkey and +32% in Poland ), Latin America (+2% in Colombia and +11% in Chile) and in China (+1% to 12,000 cases) where insolvencies quickly returned to pre Covid-19 levels in H2 2020 after a noticeable but temporary surge in Q2 (+21% y/y). The larger drop in insolvencies among countries was seen in India (-62% to 727 cases only) and among regions in Western Europe (-18% for the regional index to the lowest level since 2007).

Figure 3: Global insolvency index – Quarterly changes in 2020, y/y in %

Figure 3: Global insolvency index – Quarterly changes in 2020, y/y in %
Sources: Euler Hermes, Allianz Research. 

In Western Europe, however, the drop in insolvencies results from mixed situations (see Figure 4) and points to two clusters and three exceptions. First, a group of countries with a steady decrease in insolvencies (-34% y/y on average) amid large economic contractions (-8%): France, the UK, Italy, Belgium and Austria. Second, countries with ‘smaller’ drops both in insolvencies (-14% y/y in average) and real GDP (-3%): Germany, the Netherlands, Switzerland, Denmark, Norway and to a lesser extent Sweden. In this context, Spain and Portugal are outstanding as exceptions, with a limited decline in insolvencies despite a noticeable contraction of their economies, as well as Ireland, which was the only country to post an increase in both insolvencies and real GDP in 2020. These three countries are nevertheless those that recorded the largest declines in insolvencies prior to the crisis (-51% for Spain over 2013-2019, -59% for Portugal over 2012-2019 and -66% for Ireland over 2012-2019).
Yet, it is worth noticing that the annual drops are also hiding an uneven intra-annual trend across European countries and sectors (see Figure 5) – even if the services  sector remained the largest contributor to the number of insolvencies (74%), ahead of construction (16%), industry (9%) and agriculture (1%). Spain recovered its quarterly level of insolvencies at the end of 2020 with 1,359 cases in Q4 due to a broad-based trend reversal across sectors (industry, services and construction). Insolvencies also bounced back in Italy at the end of 2020 (to almost 2,900 cases in Q4) but they increased more moderately q/q in France and Belgium and kept on declining in Germany, the UK and the Netherlands (to 3,349, 3,601 and 588 cases, respectively, in Q4),with no noticeable pick-up among sectors.

 
Figure 4: 2020 GDP growth and insolvencies in Western Europe
 Figure 4: 2020 GDP growth and insolvencies in Western Europe
Sources: National sources, Euler Hermes, Allianz Research. 

Figure 5: 2020 insolvencies by sectors in Western Europe, by quarter, base 100: Q1 2019, selected countries

Figure 5: 2020 insolvencies by sectors in Western Europe, by quarter, base 100: Q1 2019, selected countries
Sources: National sources, Euler Hermes, Allianz Research. 

The declining trend was the result of the rapid implementation of multiple support measures  for companies, which were then extended in sync with new waves of lockdowns in several countries.
Looking at the historical sensitivity of insolvencies to macroeconomic trends , we estimate ceteris paribus that the global economic shock could have resulted in a +40% surge in worldwide insolvencies in 2020. But since 2020 ended with a -12% decrease in insolvencies, it means that the massive state interventions and further extensions of ‘whatever it takes policies’ prevented more than 35% of insolvencies globally, at least temporarily. This number of ‘spared’ insolvencies is slightly lower in the US (32% i.e. 10,400 cases) and Germany (33% i.e. 7,800 cases), two countries that both started 2020 with a low number of cases and ended the year with a ‘limited’ decrease in insolvencies. On average, we estimate that ‘spared’ insolvencies represent one out of two cases in Western Europe, but a (much) higher proportion in countries that implemented large state interventions, notably France (56% i.e. 41,000 cases) and the UK (55% i.e.18,900 cases, see Figure 6).

Figure 6: 2020 changes in insolvencies, ex post simulation vs observed figures, and ‘spared’ insolvencies, selected countries

Figure 6: 2020 changes in insolvencies, ex post simulation vs observed figures, and ‘spared’ insolvencies, selected countries
Sources: Euler Hermes, Allianz Research. 

De facto, two major kinds of state interventions were at play over the course of 2020: 1) temporary changes to insolvency regimes and 2) a broad range of temporary fiscal instruments .
The emergency adjustments of bankruptcy rules implemented in the initial phase of the crisis were key to providing extra time and flexibility to companies before they resorted to filing for bankruptcy. Countries activated various levers, including:

  • The suspension of the debtor’s obligation to file for bankruptcy (under certain conditions).
  •  The extension of deadlines for filing for bankruptcy.
  • A moratorium to prevent creditor actions against a company.
  • The relaxation of certain criteria to initiate a bankruptcy and winding-up applications (such as the threshold limit of unpaid debt).
The fiscal interventions were also massive and diverse, including tax deferrals, direct and indirect tax cuts, state loans and guarantees, debt moratoriums and short-time work schemes, in particular in Western Europe (see Figure 7), as well as some specific cases of large-scale recapitalization (i.e. in the air transport sector).
 
Countries that made larger changes to insolvency frameworks most often posted sharp decreases in insolvencies. This was the case in France, Italy, Belgium, Australia and, since end of 2020, the Netherlands. Conversely, countries with fewer or no changes to their insolvency regimes often recorded a more limited decrease in insolvencies (i.e. the US, Japan, Ireland and the Nordics). Yet, the extension of temporary amendments did not always prevent a rebound in insolvencies (eg. in Spain) and their ending did not always kickstart a pick-up in insolvencies ( France, Switzerland). The key trigger for these disparities is the uneven range, duration and effectiveness of fiscal interventions in place at the same time.
 
The first emergency packages helped companies cope with the unprecedented impact of lockdowns by preventing a liquidity crisis, notably among the sectors most severely affected by the restrictions. De facto, the IMF estimates   that the first packages of public support filled 60% of firms’ increased liquidity needs and mitigated the increase in illiquid firms, with better results for advanced economies compared to Emerging Europe (see Figure 8). Their renewal, albeit to a lesser extent, towards the end of 2020 and then the first quarter of 2021 to address subsequent waves of the pandemic, has been crucial to keep insolvencies under control. To this regard, in the US (see Figure 9), the three rounds of the Paychek Protection Program   were a major factor limiting the overall number of insolvencies in 2020 (-5% to 21,591 cases) since they were designed for “small businesses”, defined by the Small Business Administration (SBA) as a company with less than 500 employees, although the SBA uses a different number for some industries - including sole proprietors, independent contractors and self-employed persons.
 

They contributed to a large drop of Chapter 7 filings (-2,290 cases i.e. -16% y/y), the liquidation proceeding most often used by SMEs, while the restructuring proceeding mostly used by large companies, aka Chapter 11, recorded a significant surge (+1,732 cases i.e. +29%).
The increase in cash hoarding in Europe  also indicates how successful states have been in helping firms absorb the Covid-19 shock.

Figure 7: State support in Western Europe, selected countries

Figure 7: State support in Western Europe, selected countries
Sources: Various, Euler Hermes, Allianz Research. 
Figure 8: Share of illiquid firms in Europe, in %
Sources: IMF working paper, Euler Hermes, Allianz Research
Figure 9: Business insolvencies in the US, by types of proceeding, annual number
Sources: US Courts, Euler Hermes, Allianz Research

The first figures available for 2021 so far do not show any new trend reversal on the upside globally (see Figure 10), with a low level of insolvencies in most countries, except for Poland, Spain, Denmark and to a lesser extent South Africa. In this context, our Global Insolvency Index is set to post another steady decrease y/y in Q1 2021, potentially still a double-digit one for the fourth consecutive quarter. Q2 2021 should see some materialization of the basis effect created by the impact of lockdown measures on business courts in the same period of 2020 – as illustrated in an extreme way by the surge of insolvencies in Hong Kong as of Q1 2021, which is reflecting the absence of official registrations all along Q1 2020 (with two cases). Yet, we still expect H1 2021 to see a prolonged low number of insolvencies due to the timeline of support measures by country (see Box). 

Figure 10: Business insolvencies – first figures available for 2021 (selected countries)

Figure 10: Business insolvencies – first figures available for 2021 (selected countries)
Sources: National sources, Euler Hermes, Allianz Research
Our baseline scenario is that the phasing-out process will be asymmetric due to the uneven sanitary situation and the multi-speed economic recovery . Under current circumstances, the normalization of insolvencies is likely to start to materialize globally in H2 2021 and to gain traction in 2022. The low 2020 insolvency numbers are mechanically creating a base effect for a broad-based and noticeable increase in y/y terms for 2021. Our headline indicator would rebound by +14% y/y in 2021 and keep on increasing by +16% y/y in 2022. In 2021, less than half of the countries monitored would return to their 2019 level in insolvencies. In 2022, business insolvencies are likely to exceed pre-pandemic levels in almost all countries, but they would still remain below post GFC levels in advanced economies. Western Europe (due to most countries) and Asia (but mainly due to India) will drive the insolvency rebound over 2021-2022.
 
Where are the hotspots? We expect emerging countries, notably in Central and Eastern Europe and Latin America (see Figures 11 and 12), to record a faster rebound in insolvencies and to largely exceed pre Covid-19 levels in insolvencies by 2022. The former would see 28% more insolvencies in 2022 compared to 2019 compared to 23% for the latter: both regions were hit in 2020 and early 2021 by a succession of lockdowns/curfews due to several waves of the pandemic but implemented less intense/less effective policy measures to support firms. Asia, however, will stand out, thanks to its faster exit from the pandemic and its economic recovery, with India as the key exception due to the major suspension of courts’ activity over 2020-2021. Most other emerging countries would go back to a ‘natural’ number and trend in insolvencies, related to their business demographic and economic outlook. Western Europe will post mixed trends, with two main clusters of countries:
 
(i) Those that will post the largest excess of insolvencies by 2022 compared to 2019, notably in Southern Europe (+38% for Spain and Greece, +34% for Portugal and +17% for Italy) due to a higher share of sectors sensitive to Covid-19 restrictions. Spain would register 5,110 and 5,750 insolvencies, respectively, in 2021 and 2022 compared to 4,162 in 2019. In Italy, insolvencies would reach 11,500 cases in 2021 and 13,000 cases in 2022, compared to 11,106 in 2019.
 
(ii) Those that will see the bulk of insolvencies materializing in 2022 and beyond ( France, the UK, Belgium and to a lesser extent Germany) due to the implementation and/or extension of the largest support packages. France would again record 56,000 annual cases in 2022, the UK 23,500 cases and Germany 19,600 cases.
 
In this context, the US is a key exception, with a prolonged low number of insolvencies both in 2021 (21,600 cases) and 2022 (23,860), compared to 23,900 on average over the 2014-2019 period, due mainly to the combination of the PPP virus loan program (we expect the vast majority of borrowers to apply for and receive forgiveness) and the major boost expected from President Biden’s stimulus package .
 
There are several risks to this baseline scenario, mainly linked to the obstacles to overcome for a post Covid-19 recovery  but also the uncertainties around governments’ willingness and capacities to ensure a smooth ‘back to normal’. Any addition or prolonging of existing support measures for companies would limit the number of insolvencies in the short term and delay further the inevitable normalization, raising the risk of more insolvencies in the medium and long term.
 

Figure 11: Yearly changes in insolvencies in 2021 and 2022 (in %)

Figure 11: Yearly changes in insolvencies in 2021 and 2022 (in %)
Sources: National sources, Euler Hermes, Allianz Research
Figure 12: Euler Hermes Insolvency Heat Map 2022
Sources: Euler Hermes, Allianz Research