Executive Summary
- The invasion of Ukraine and renewed Covid-19 outbreaks in China are hitting global trade with a double whammy in 2022: lower volumes and higher prices. We now expect trade to grow by +4.0% in volume terms in 2022 (-2pp lower than expected before the war), and as much as +10.9% in value terms (vs. +7.2% previously expected). Already existing before the war, the risk of a double-dip in global trade volume in H1 2022 has increased.
- The confidence and demand shock will result in a loss of USD480bn in exports to Russia and Eurozone countries in 2022 (roughly evenly split between the two destinations), with companies in Eastern Europe the most exposed.
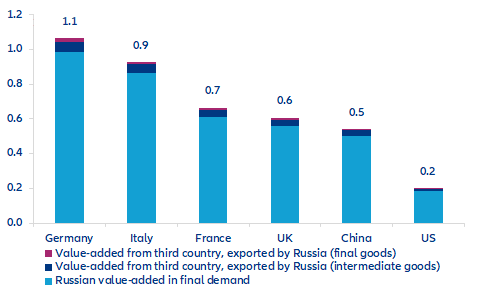
- Looking at Russia as a supplier in global and regional value-chains, Eastern Europe remains the most at risk, while a complete cut-off of relations would mean the Eurozone’s largest four economies losing up to 0.4% of their GDPs and 1.1% of their exports.
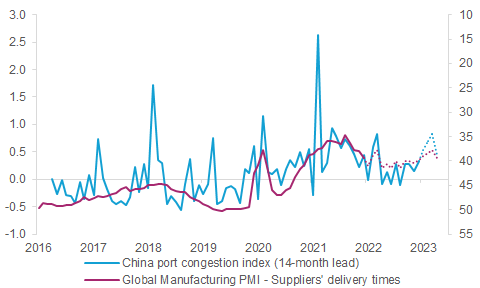
- Renewed Covid-19 outbreaks in China, where the zero-Covid policy continues, is the larger issue for global supply chains: Delivery times are likely to remain elevated throughout 2022.
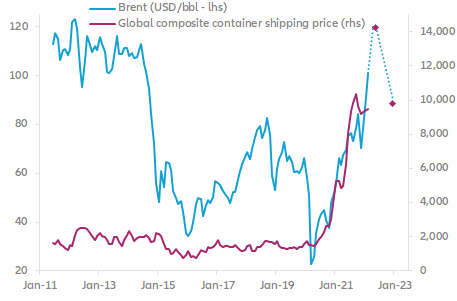
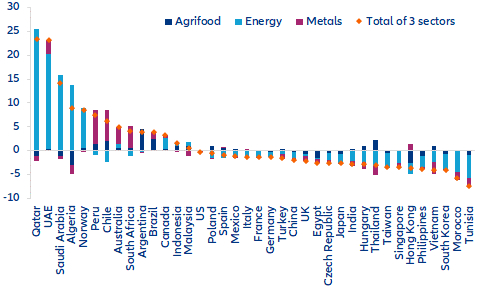
- The cost of trade could be pushed up by higher oil prices: Brent and container freight prices have shown a 90% correlation since 2020, suggesting a potential record-high peak of USD14,000/FEU for freight rates. Net exporters of commodities (Middle East, Norway, some economies in Latin America) could benefit from higher commodity prices and potential substitution effects away from Russia. In Europe, Germany’s trade surplus would be reduced by one third and France’s trade deficit could rise by more than two thirds.
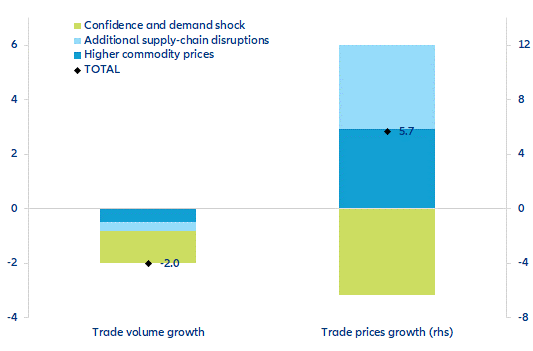
The invasion of Ukraine and renewed Covid-19 outbreaks in China will hit global trade with a double whammy in 2022: lower volumes and higher prices. We now expect trade to grow by +4.0% in volume terms in 2022 (-2pp lower than expected before the war), while trade in value terms surges by +10.9% (vs. +7.2% previously expected). After the contraction in Q3 2021, the risk of a double-dip in global trade volume in H1 2022 has increased further - not only due to supply-chain bottlenecks, but also because of lower demand. The economic consequences of the war in Ukraine will slow GDP growth around the world, especially for economies in Europe. The resulting confidence and demand shock explains more than half of the downward revision in our forecast for trade growth in volume in 2022 (see Figure 1). Conversely, trade prices growth has been revised upwards by 5.7pp, with commodity prices and additional supply-chain disruptions contributing roughly equally.
Figure 1 – Breakdown of 2022 trade growth forecast revisions (pp)